StereographicPlot#
- class orix.plot.StereographicPlot(*args, hemisphere: Literal['upper', 'lower'] = 'upper', azimuth_resolution: int | float = 10, polar_resolution: int | float = 10, **kwargs)[source]#
Bases:
AxesStereographic plot for plotting
Vector3d.- Parameters:
- *args
Arguments passed to
matplotlib.axes.Axes.- hemisphere
Which hemisphere to plot vectors in, either “upper” (default) or “lower”.
- azimuth_resolution
Resolution of azimuth grid lines in degrees. Default is 10 degrees.
- polar_resolution
Resolution of polar grid lines in degrees. Default is 10 degrees.
- **kwargs
Keyword arguments passed to
matplotlib.axes.Axes.
Attributes
Return or set the hemisphere to plot, either "upper" or "lower".
Return the projection pole, either -1 or 1, where -1 (1) means the projection point of the stereographic transform is the lower (upper) pole [00-1] ([001]), i.e. only vectors with z > 0 (z < 0) are plotted.
Methods
Clear the Axes.
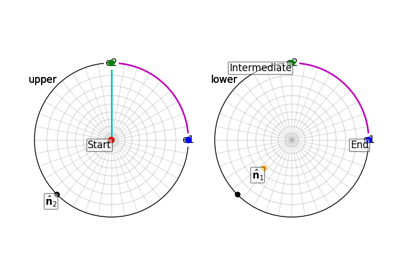
StereographicPlot.draw_circle(*args[, ...])Draw great or small circles with a given opening_angle to one or multiple vectors.
Return a format string formatting the x, y coordinates.
StereographicPlot.plot(*args, **kwargs)Draw straight lines between vectors.
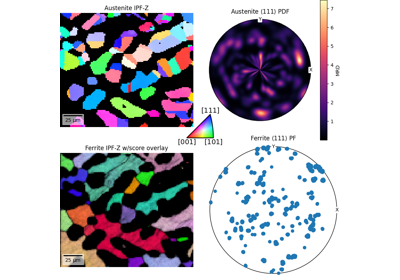
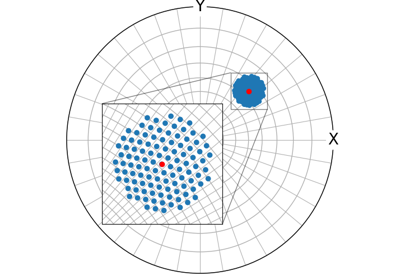
Compute the Pole Density Function (PDF) of vectors in the stereographic projection.
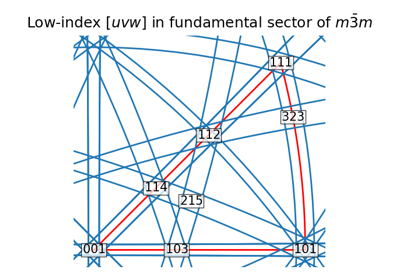
Restrict the stereographic axis to a
FundamentalSector, typically obtained fromfundamental_sector.StereographicPlot.scatter(*args, **kwargs)A scatter plot of vectors.
StereographicPlot.set_labels([xlabel, ...])Set the reference frame's axes labels.
StereographicPlot.show_hemisphere_label(**kwargs)Add a hemisphere label (
"upper"/"lower") to the upper left of the plot.Turn a stereographic grid on or off, and set the azimuth and polar grid resolution in degrees.
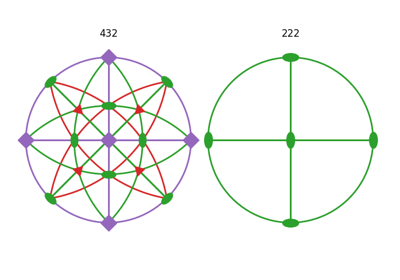
StereographicPlot.symmetry_marker(v, fold, ...)Plot 2-, 3- 4- or 6-fold symmetry marker(s).
StereographicPlot.text(*args[, offset])Add text to the axes.
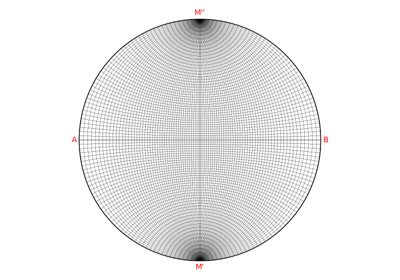
StereographicPlot.wulff_net([show_grid, ...])Turn a wulff net grid on or off, and set the grid resolution in degrees.