wulff_net#
- InversePoleFigurePlot.wulff_net(show_grid: bool | None = None, lat_resolution: float | int | None = None, long_resolution: float | int | None = None, lat_resolution_major: float | int | None = None, long_resolution_major: float | int | None = None, wulff_net_cap: float | int | None = None, linewidth_ratio: float | int = 2) None[source]#
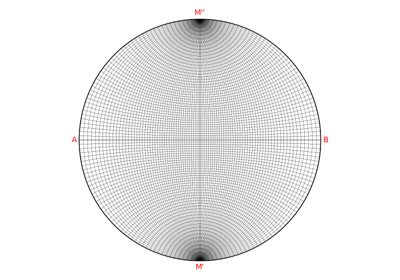
Turn a wulff net grid on or off, and set the grid resolution in degrees.
- Parameters:
- show_grid
Whether to show grid lines. If any keyword arguments are passed, this is set to True. If not given and there are no keyword arguments, the grid lines are toggled.
- lat_resolution
Latitudinal (up and down) grid spacing in degrees.If not given, the current resolution is used (2 degrees by default).
- long_resolution
Longitudinal (left and right) grid spacing in degrees. If not given, the current resolution is used (2 degrees by default).
- lat_resolution_major
Identical to lat_resolution, but for the major grid lines (10 degrees resolution by default).
- long_resolution_major
Identical to long_resolution, but for the major grid lines (10 degrees resolution by default).
- wulff_net_cap
The angular spread of the cap around the north and south poles of the plot in degrees, within which longitudinal lines are not drawn. If not given, the current resolution is used (10 degrees by default).
- linewidth_ratio
Ratio between the thickness of the major and minor grid lines. Minor grid line properties are determined by the “grid.linewidth” parameter in Matplotlib’s rcParams, the same way
matplotlib.axes.Axes.grid()objects are. Major grid lines are then set relative to the minor values.
See also