add_colorbar#
- CrystalMapPlot.add_colorbar(label: str | None = None, **kwargs) Colorbar[source]#
Add an opinionated colorbar to the figure and return it.
The colorbar is also available as an attribute
colorbar.- Parameters:
- label
Colorbar title, default is
None.- **kwargs
Keyword arguments passed to
mpl_toolkits.axes_grid1.make_axes_locatable.append_axes().
- Returns:
cbarColorbar.
Examples
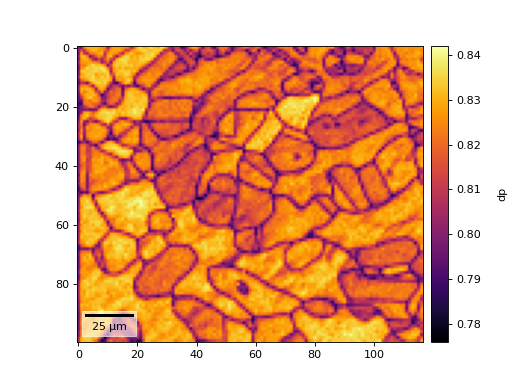
>>> from orix import data
>>> xmap = data.sdss_ferrite_austenite()
>>> xmap.scan_unit
'um'
Plot a map property and add a colorbar
>>> fig = plt.figure()
>>> ax = fig.add_subplot(projection="plot_map")
>>> im = ax.plot_map(xmap, xmap.dp, cmap="inferno")
>>> cbar = ax.add_colorbar("Dot product")
If the default options are not satisfactory, the colorbar can be updated
>>> _ = cbar.ax.set_ylabel(ylabel="dp", rotation=90)