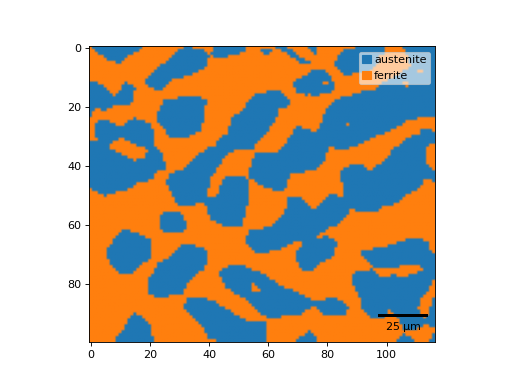
add_scalebar#
- CrystalMapPlot.add_scalebar(crystal_map: orix.crystal_map.CrystalMap, **kwargs) ScaleBar[source]#
Add a scalebar to the axes instance and return it.
The scalebar is also available as an attribute
scalebar.- Parameters:
- crystal_map
Crystal map instance to obtain necessary data from.
- **kwargs
Keyword arguments passed to
matplotlib_scalebar.scalebar.ScaleBar.
- Returns:
barScalebar.
Examples
>>> from orix import data, plot
>>> xmap = data.sdss_ferrite_austenite()
Create a phase map without a scale bar and add it afterwards
>>> fig = plt.figure()
>>> ax = fig.add_subplot(projection="plot_map")
>>> im = ax.plot_map(xmap, scalebar=False)
>>> sbar = ax.add_scalebar(xmap, location=4, frameon=False)

