draw_circle#
- Miller.draw_circle(projection: str = 'stereographic', figure: Figure | None = None, opening_angle: float | ndarray = 1.5707963267948966, steps: int = 100, reproject: bool = False, axes_labels: List[str] | None = None, hemisphere: str | None = None, show_hemisphere_label: bool | None = None, grid: bool | None = None, grid_resolution: Tuple[float, float] | None = None, figure_kwargs: Dict | None = None, reproject_plot_kwargs: Dict | None = None, return_figure: bool = False, **kwargs: Any) Figure | None[source]#
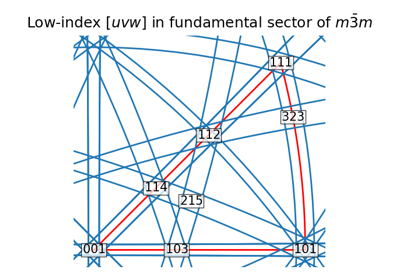
Draw great or small circles with a given
opening_angleto to the vectors in the stereographic projection.A vector must be present in the current hemisphere for its circle to be drawn.
- Parameters:
- projection
Which projection to use. The default is
"stereographic", the only current option.- figure
Which figure to plot onto. Default is
None, which creates a new figure.- opening_angle
Opening angle(s) around the vector(s). Default is \(\pi/2\), giving a great circle. If an array is passed, its size must be equal to the number of vectors.
- steps
Number of vectors to describe each circle, default is 100.
- reproject
Whether to reproject parts of the circle(s) visible on the other hemisphere. Reprojection is achieved by reflection of the circle(s) parts located on the other hemisphere in the projection plane. Ignored if hemisphere is
"both". Default isFalse.- axes_labels
Reference frame axes labels, defaults to
[None, None, None].- hemisphere
Which hemisphere(s) to plot the vectors in, defaults to
None, which means"upper"if a new figure is created, otherwise adds to the current figure’s hemispheres. Options are"upper","lower", and"both", which plots two projections side by side.- show_hemisphere_label
Whether to show hemisphere labels
"upper"or"lower". Default isTrueifhemisphereis"both", otherwiseFalse.- grid
Whether to show the azimuth and polar grid. Default is whatever
axes.gridis set to inmatplotlib.rcParams.- grid_resolution
Azimuth and polar grid resolution in degrees, as a tuple. Default is whatever is default in
stereographic_grid.- figure_kwargs
Dictionary of keyword arguments passed to
matplotlib.pyplot.subplots().- reproject_plot_kwargs
Keyword arguments passed to
matplotlib.axes.Axes.plot()to alter the appearance of parts of the circle(s) visible on the other hemisphere ifreproject=True. These lines are dashed by default. Values used for circle(s) on the current hemisphere are used unless values are passed here.- return_figure
Whether to return the figure (default is
False).- **kwargs
Keyword arguments passed to
matplotlib.axes.Axes.plot()to alter the circles’ appearance.
- Returns:
figThe created figure, returned if
return_figure=True.
Notes
This is a somewhat customizable convenience method which creates a figure with axes using
StereographicPlot, however, it is meant for quick plotting and prototyping. This figure and the axes can also be created using Matplotlib directly, which is more customizable.

