InversePoleFigurePlot#
- class orix.plot.InversePoleFigurePlot(*args: Any, symmetry: Symmetry | None = None, direction: Vector3d | None = None, hemisphere: Literal['upper', 'lower', 'both'] | None = None, **kwargs: Any)[source]#
Bases:
StereographicPlotInverse pole figure plot of
Vector3d, which is a stereographic plot for showing sample directions with respect to a crystal reference frame.- Parameters:
- *args
Arguments passed to
StereographicPlot.- symmetry
Laue group symmetry of crystal to plot directions with. If not given, point group C1 (only identity rotation) is used.
- direction
Sample direction to plot with respect to crystal directions. If not given, the out of plane direction, sample Z, is used.
- hemisphere
Which hemisphere(s) to plot the vectors in. If not given, “upper” is used. Options are “upper”, “lower” and “both”, which plots two projections side by side.
- **kwargs
Keyword arguments passed to
StereographicPlot.
Attributes
Return or set the hemisphere to plot, either "upper" or "lower".
Return the projection pole, either -1 or 1, where -1 (1) means the projection point of the stereographic transform is the lower (upper) pole [00-1] ([001]), i.e. only vectors with z > 0 (z < 0) are plotted.
Methods
Clear the Axes.
InversePoleFigurePlot.draw_circle(*args[, ...])Draw great or small circles with a given opening_angle to one or multiple vectors.
Return a format string formatting the x, y coordinates.
InversePoleFigurePlot.plot(*args, **kwargs)Draw straight lines between vectors.
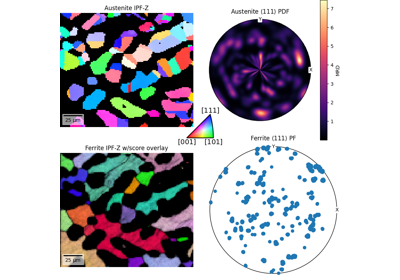
Plot an IPF color key code on this axis.
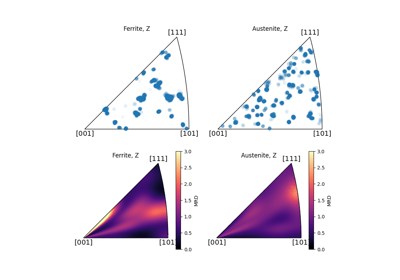
Compute the Inverse Pole Density Function (IPDF) of vectors in the stereographic projection.
Restrict the stereographic axis to a
FundamentalSector, typically obtained fromfundamental_sector.InversePoleFigurePlot.scatter(*args, **kwargs)A scatter plot of sample directions rotated by orientations, or orientations to rotate sample directions with.
InversePoleFigurePlot.set_labels([xlabel, ...])Set the reference frame's axes labels.
Add a hemisphere label (
"upper"/"lower") to the upper left outside the inverse pole figure.Turn a stereographic grid on or off, and set the azimuth and polar grid resolution in degrees.
Plot 2-, 3- 4- or 6-fold symmetry marker(s).
InversePoleFigurePlot.text(*args[, offset])Add text to the axes.
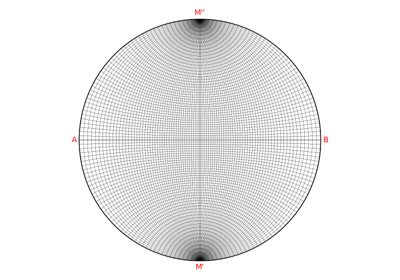
InversePoleFigurePlot.wulff_net([show_grid, ...])Turn a wulff net grid on or off, and set the grid resolution in degrees.