Note
Go to the end to download the full example code.
Visualizing paths between rotations and vectors#
This example shows how define and plot paths through either rotation or vector space. This is akin to describing crystallographic fiber textures in metallurgy, or the shortest arcs connecting points on the surface of a unit sphere.
In both cases, “shortest” is defined as the route that minimizes the movement required to transform from point to point, which is typically not a stright line when plotted into a euclidean projection (axis-angle, stereographic, etc.).
import matplotlib as mpl
import matplotlib.pyplot as plt
import numpy as np

from orix.plot import register_projections
from orix.plot.direction_color_keys import DirectionColorKeyTSL
from orix.quaternion import Orientation, Rotation
from orix.quaternion.symmetry import C1, Oh
from orix.sampling import sample_S2
from orix.vector import Vector3d

register_projections()  # Register our custom Matplotlib projections
np.random.seed(2319)  # Reproducible random data

# Number of steps along each path
n_steps = 30
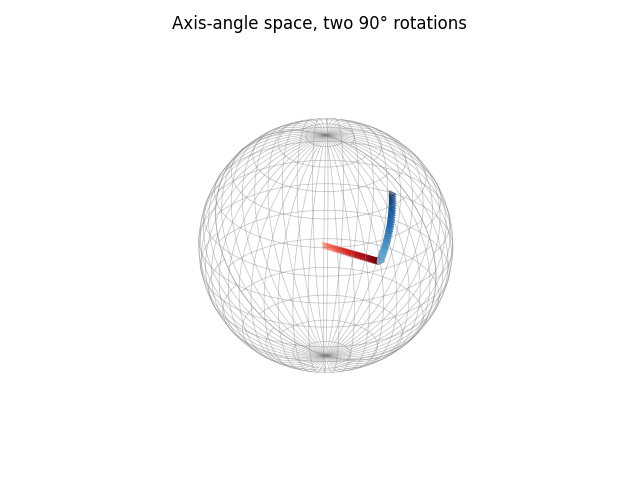
Example 1: Continuous path#
This plot traces the path of an object rotated 90 degrees around the x-axis, then 90 degrees around the y-axis.
oris1 = Orientation.from_axes_angles(
    [[1, 0, 0], [1, 0, 0], [0, 1, 0]], [0, 90, 90], degrees=True
)
oris1[2] = oris1[1] * oris1[2]
path = Orientation.from_path_ends(oris1, steps=n_steps)

# Create a list of RGBA color values for a gradient red line and blue line
colors1 = np.vstack(
    [
        mpl.colormaps["Reds"](np.linspace(0.5, 1, n_steps)),
        mpl.colormaps["Blues"](np.linspace(0.5, 1, n_steps)),
    ]
)

# Here, we use the built-in plotting method from Orientation.scatter to auto-generate
# the plot.
# This is especially handy when plotting only a single set of orientations.
path.scatter(marker=">", c=colors1)
_ = plt.gca().set_title("Axis-angle space, two 90\N{DEGREE SIGN} rotations")
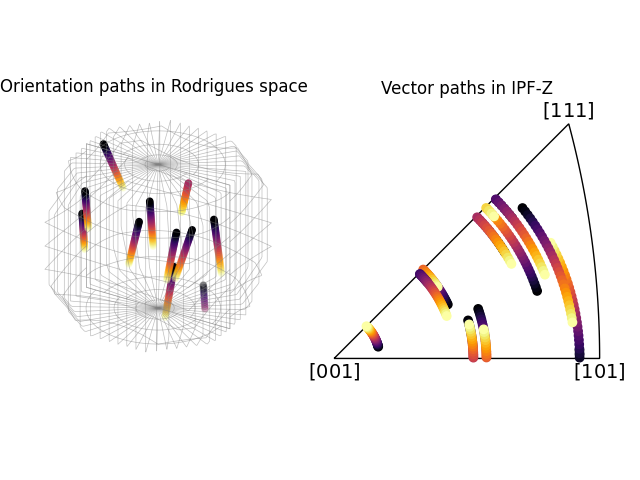
Example 2: Multiple paths#
This plot shows several paths through the cubic (m3m) fundamental zone created by rotating 20 randomly chosen points 30 degrees around the z-axis. These paths are drawn in Rodrigues space, which is an equal-angle projection of rotation space. As such, notice how all lines tracing out axial rotations are straight, but lines starting closer to the center of the fundamental zone appear shorter.
The same paths are then also plotted in the inverse pole figure (IPF) for the sample direction (0, 0, 1), IPF-Z.
# Random orientations with the cubic *m3m* crystal symmetry, located inside the
# fundamental zone of the proper point group (*432*)
oris2 = Orientation.random(10, symmetry=Oh).reduce()

# Rotation around the z-axis
ori_shift = Orientation.from_axes_angles([0, 0, 1], -30, degrees=True)

# Plot path for the first orientation (to get a figure to add to)
rot_end = ori_shift * oris2[0]
points = Orientation.stack([oris2[0], rot_end])
path = Orientation.from_path_ends(points, steps=n_steps)
path.symmetry = Oh

colors2 = mpl.colormaps["inferno"](np.linspace(0, 1, n_steps))
fig = path.scatter("rodrigues", position=121, return_figure=True, c=colors2)
path.scatter("ipf", position=122, figure=fig, c=colors2)

# Plot the rest
rod_ax, ipf_ax = fig.axes
rod_ax.set_title("Orientation paths in Rodrigues space")
ipf_ax.set_title("Vector paths in IPF-Z", pad=15)

for ori_start in oris2[1:]:
    rot_end = ori_shift * ori_start
    points = Orientation.stack([ori_start, rot_end])
    path = Orientation.from_path_ends(points, steps=n_steps)
    path.symmetry = Oh
    rod_ax.scatter(path, c=colors2)
    ipf_ax.scatter(path, c=colors2)
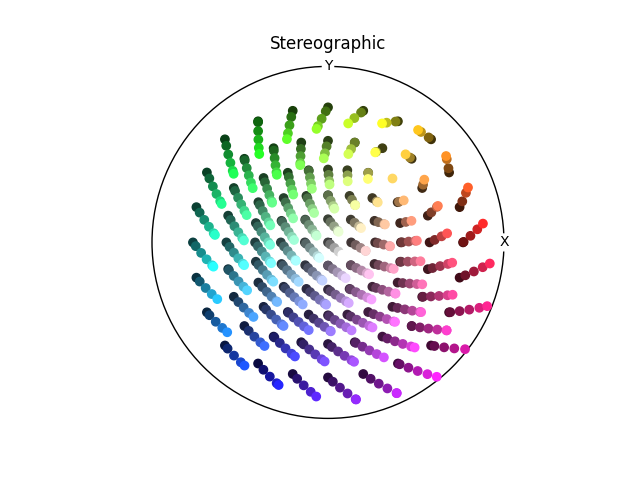
Example 3: Multiple vector paths#
Rotate vectors around the (1, 1, 1) axis on a stereographic plot.
vec_ax = plt.subplot(projection="stereographic")
vec_ax.set_title(r"Stereographic")
vec_ax.set_labels("X", "Y")

ipf_colormap = DirectionColorKeyTSL(C1)

# Define a mesh of vectors with approximately 20 degree spacing, and within 80 degrees
# of the z-axis
vecs = sample_S2(20)
vecs = vecs[vecs.polar < np.deg2rad(80)]

# Define a 15 degree rotation around (1, 1, 1)
rot111 = Rotation.from_axes_angles([1, 1, 1], [0, 15], degrees=True)

for vec in vecs:
    path_ends = rot111 * vec

    # Handle case where path start end end are the same vector
    if np.isclose(path_ends[0].dot(path_ends[1]), 1):
        vec_ax.scatter(path_ends[0], c=ipf_colormap.direction2color(path_ends[0]))
        continue

    # Color each path using a gradient based on the IPF coloring
    colors3 = ipf_colormap.direction2color(vec)
    path = Vector3d.from_path_ends(path_ends, steps=100)
    colors3_segment = colors3 * np.linspace(0.25, 1, path.size)[:, np.newaxis]
    vec_ax.scatter(path, c=colors3_segment)
Total running time of the script: (0 minutes 2.425 seconds)
Estimated memory usage: 542 MB