Visualizing point groups#
This tutorial shows point group symmetry operations \(s\) in the stereographic projection.
Vectors located on the upper (z >= 0) hemisphere are displayed as points (o), whereas vectors on the lower hemisphere are reprojected onto the upper hemisphere and shown as crosses (+) by default. For more information about plot formatting and visualization, see Vector3d.scatter().
Further explanation of these figures is provided at http://xrayweb.chem.ou.edu/notes/symmetry.html#point.
[1]:
%matplotlib inline
from matplotlib import pyplot as plt
import numpy as np

from orix import plot
from orix.quaternion import Rotation, symmetry
from orix.vector import Vector3d

plt.rcParams.update({"font.size": 15})
For example, the \(S = O\) or \(432\) point group:
[2]:
symmetry.O.plot()
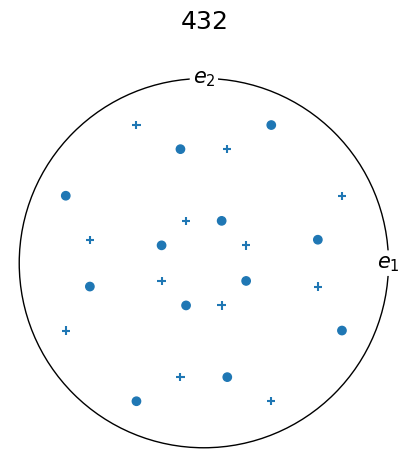
\((\mathbf{e_1}, \mathbf{e_2}, \mathbf{e_3})\) are the unit vectors of the standard Cartesian (orthonormal) reference frame (see the crystal reference frame example for more details).
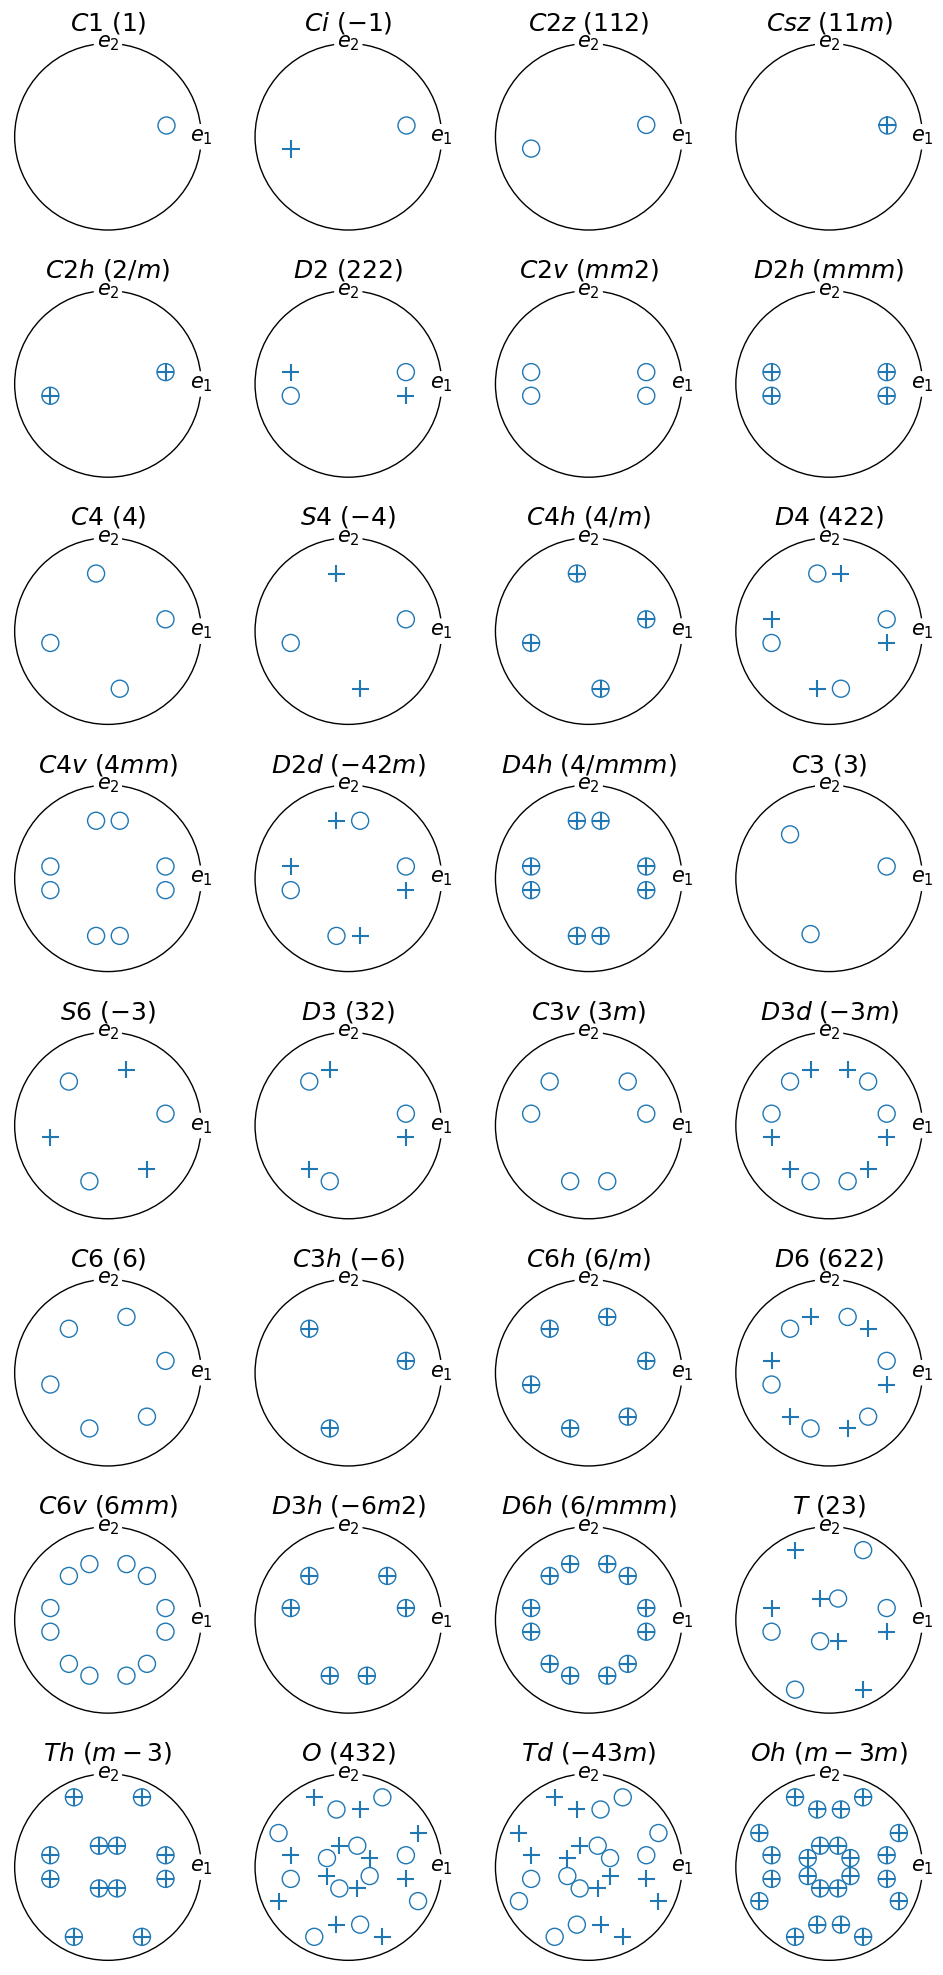
The stereographic projection of all point groups is shown below:
[3]:
# fmt: off
schoenflies = [
    "C1", "Ci",                                          # triclinic
    "C2x", "C2y", "C2z", "Csx", "Csy", "Csz", "C2h",     # monoclinic
    "D2", "C2v", "D2h",                                  # orthorhombic
    "C4", "S4", "C4h", "D4", "C4v", "D2d", "D4h",        # tetragonal
    "C3", "S6", "D3x", "D3y", "D3", "C3v", "D3d", "C6",  # trigonal
    "C3h", "C6h", "D6", "C6v", "D3h", "D6h",             # hexagonal
    "T", "Th", "O", "Td", "Oh",                          # cubic
]
# fmt: on

assert len(symmetry._groups) == len(schoenflies)

schoenflies = [
    S for S in schoenflies if not (S.endswith("x") or S.endswith("y"))
]

assert len(schoenflies) == 32

R = Rotation.from_axes_angles((-1, 8, 1), 65, degrees=True)

fig, ax = plt.subplots(
    nrows=8,
    ncols=4,
    figsize=(10, 20),
    subplot_kw={"projection": "stereographic"},
    layout="tight",
)
ax = ax.ravel()

for i, S in enumerate(schoenflies):
    Si = getattr(symmetry, S)

    R_Si = Si.outer(R)
    v = R_Si * Vector3d.zvector()

    # reflection in the projection plane (x-y) is performed internally in
    # Symmetry.plot() or when using the `reproject=True` argument for
    # Vector3d.scatter()
    v_reproject = Vector3d(v.data.copy())
    v_reproject.z *= -1

    # the Symmetry marker formatting for vectors on the upper and lower
    # hemisphere can be set using `kwargs` and `reproject_scatter_kwargs`,
    # respectively, for Symmetry.plot()

    # vectors on the upper hemisphere are shown as open circles
    ax[i].scatter(v, marker="o", c="None", ec="C0", s=150)
    # vectors on the lower hemisphere are reprojected onto the upper
    # hemisphere and shown as crosses
    ax[i].scatter(v_reproject, marker="+", c="C0", s=150)

    ax[i].set_title(f"${S}$ $({Si.name})$")
    ax[i].set_labels("$e_1$", "$e_2$", None)