Note
Go to the end to download the full example code.
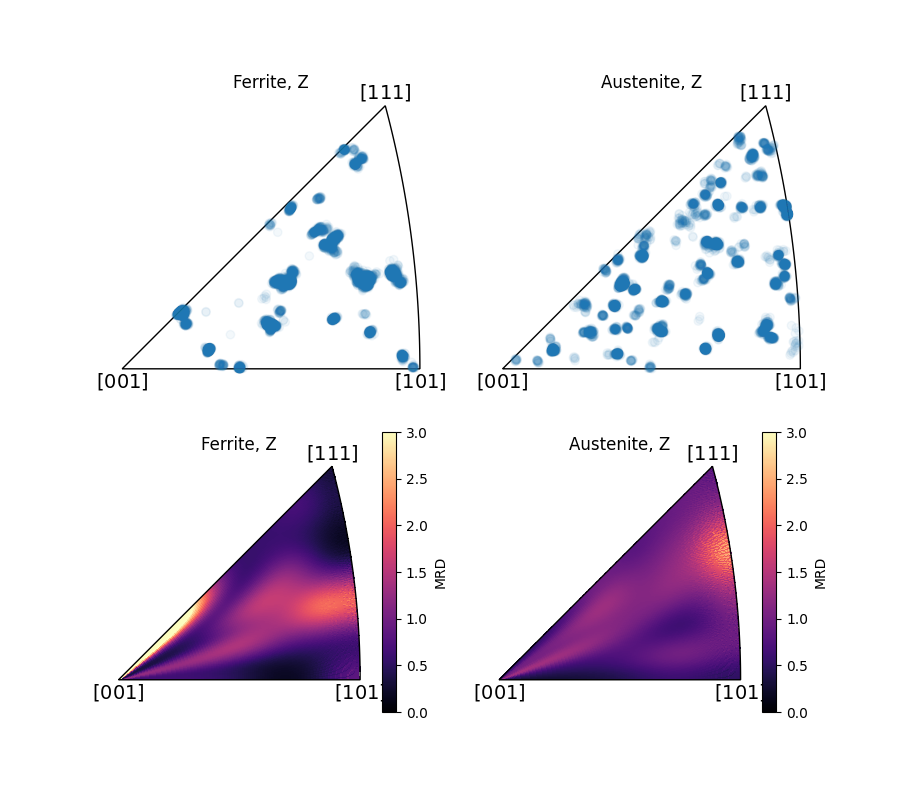
Inverse pole density function#
This example shows how to plot an inverse pole density function (IPDF) [Rohrer et al., 2004] to inspect the distribution of crystal directions \(t\) pointing in some direction in the sample reference frame \((x, y, z)\).
Phase   Orientations       Name  Space group  Point group  Proper point group       Color
    1   5657 (48.4%)  austenite         None          432                 432    tab:blue
    2   6043 (51.6%)    ferrite         None          432                 432  tab:orange
Properties: iq, dp
Scan unit: um
import matplotlib.pyplot as plt

from orix import data
from orix.plot import register_projections
from orix.vector import Vector3d

register_projections()  # Register our custom Matplotlib projections

xmap = data.sdss_ferrite_austenite(allow_download=True)
print(xmap)

# Extract orientations, O
pg_m3m = xmap.phases[1].point_group.laue
O_fe = xmap["ferrite"].orientations
O_au = xmap["austenite"].orientations

# Some sample direction, v
v = Vector3d([0, 0, 1])
v_title = "Z"

# Rotate sample direction v into every crystal orientation O
t_fe = O_fe * v
t_au = O_au * v

# Set IPDF range
vmin, vmax = (0, 3)

subplot_kw = {"projection": "ipf", "symmetry": pg_m3m, "direction": v}
fig = plt.figure(figsize=(9, 8))

ax0 = fig.add_subplot(221, **subplot_kw)
ax0.scatter(O_fe, alpha=0.05)
_ = ax0.set_title(f"Ferrite, {v_title}")

ax1 = fig.add_subplot(222, **subplot_kw)
ax1.scatter(O_au, alpha=0.05)
_ = ax1.set_title(f"Austenite, {v_title}")

ax2 = fig.add_subplot(223, **subplot_kw)
ax2.pole_density_function(t_fe, vmin=vmin, vmax=vmax)
_ = ax2.set_title(f"Ferrite, {v_title}")

ax3 = fig.add_subplot(224, **subplot_kw)
ax3.pole_density_function(t_au, vmin=vmin, vmax=vmax)
_ = ax3.set_title(f"Austenite, {v_title}")
Total running time of the script: (0 minutes 6.335 seconds)
Estimated memory usage: 2277 MB