CrystalMap#
- class orix.crystal_map.CrystalMap(rotations: Rotation | CrystalMap, phase_id: ndarray | None = None, x: ndarray | None = None, y: ndarray | None = None, phase_list: PhaseList | None = None, prop: dict | None = None, scan_unit: str | None = 'px', is_in_data: ndarray | None = None)[source]#
Bases:
objectCrystallographic map of orientations, crystal phases and key properties associated with every spatial coordinate in a 1D or 2D.
- Parameters:
- rotations
Rotation in each point. Must be passed with all spatial dimensions in the first array axis (flattened). May contain multiple rotations per point, included in the second array axes. Crystal map data size is set equal to the first array axis’ size.
- phase_id
Phase ID of each pixel. IDs equal to
-1are considered not indexed. If not given, all points are considered to belong to one phase with ID0.- x
Map x coordinate of each data point. If not given, the map is assumed to be 1D, and it is set to an array of increasing integers from 0 to the length of the
phase_idarray.- y
Map y coordinate of each data point. If not given, the map is assumed to be 1D, and it is set to
None.- phase_list
A list of phases in the data with their with names, space groups, point groups, and structures. The order in which the phases appear in the list is important, as it is this, and not the phases’ IDs, that is used to link the phases to the input
phase_idif the IDs aren’t exactly the same as inphase_id. If not given, a phase list with as many phases as there are unique phase IDs inphase_idis created.- prop
Dictionary of properties of each data point.
- scan_unit
Length unit of the data. Default is
"px".- is_in_data
Array of booleans signifying whether a point is in the data.
See also
Notes
Data is stored as 1D arrays and reshaped when necessary.
Examples
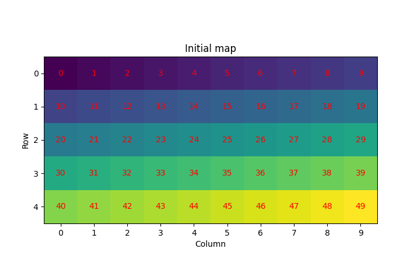
Constructing a crystal map from scratch, with two rows and three columns and containing Austenite and Ferrite orientations
>>> from diffpy.structure import Atom, Lattice, Structure
>>> from orix.crystal_map import create_coordinate_arrays, CrystalMap, PhaseList
>>> from orix.quaternion import Rotation
>>> coords, n = create_coordinate_arrays(shape=(2, 3))
>>> structures = [
...     Structure(
...         title="austenite",
...         atoms=[Atom("fe", [0] * 3)],
...         lattice=Lattice(0.360, 0.360, 0.360, 90, 90, 90)
...     ),
...     Structure(
...         title="ferrite",
...         atoms=[Atom("fe", [0] * 3)],
...         lattice=Lattice(0.287, 0.287, 0.287, 90, 90, 90)
...     )
... ]
>>> xmap = CrystalMap(
...     rotations=Rotation.from_axes_angles([0, 0, 1], np.linspace(0, np.pi, n)),
...     phase_id=np.array([0, 0, 1, 1, 0, 1]),
...     x=coords["x"],
...     y=coords["y"],
...     phase_list=PhaseList(space_groups=[225, 229], structures=structures),
...     prop={"score": np.random.random(n)},
...     scan_unit="nm",
... )
>>> xmap
Phase  Orientations       Name  Space group  Point group  Proper point group       Color
    0     3 (50.0%)  austenite        Fm-3m         m-3m                 432    tab:blue
    1     3 (50.0%)    ferrite        Im-3m         m-3m                 432  tab:orange
Properties: score
Scan unit: nm
Data in a crystal map can be selected in multiple ways. Let’s demonstrate this on a dual phase dataset available in the
datamodule>>> from orix import data >>> xmap = data.sdss_ferrite_austenite(allow_download=True) >>> xmap Phase Orientations Name Space group Point group Proper point group Color 1 5657 (48.4%) austenite None 432 432 tab:blue 2 6043 (51.6%) ferrite None 432 432 tab:orange Properties: iq, dp Scan unit: um >>> xmap.shape (100, 117)
Selecting based on coordinates, passing ranges (slices), integers or both
>>> xmap2 = xmap[20:40, 50:60]
>>> xmap2
Phase  Orientations       Name  Space group  Point group  Proper point group       Color
    1   148 (74.0%)  austenite         None          432                 432    tab:blue
    2    52 (26.0%)    ferrite         None          432                 432  tab:orange
Properties: iq, dp
Scan unit: um
>>> xmap2.shape
(20, 10)
>>> xmap2 = xmap[20:40, 3]
>>> xmap2
Phase  Orientations       Name  Space group  Point group  Proper point group       Color
    1    16 (80.0%)  austenite         None          432                 432    tab:blue
    2     4 (20.0%)    ferrite         None          432                 432  tab:orange
Properties: iq, dp
Scan unit: um
>>> xmap2.shape
(20, 1)
Note that 1-dimensions are NOT removed
>>> xmap2 = xmap[10, 10]
>>> xmap2
Phase  Orientations     Name  Space group  Point group  Proper point group       Color
    2    1 (100.0%)  ferrite         None          432                 432  tab:orange
Properties: iq, dp
Scan unit: um
>>> xmap2.shape
(1, 1)
Select by phase name(s)
>>> xmap2 = xmap["austenite"]
>>> xmap2
Phase  Orientations       Name  Space group  Point group  Proper point group     Color
    1  5657 (100.0%)  austenite         None          432                 432  tab:blue
Properties: iq, dp
Scan unit: um
>>> xmap2.shape
(100, 117)
>>> xmap["austenite", "ferrite"]
Phase  Orientations       Name  Space group  Point group  Proper point group       Color
    1  5657 (48.4%)  austenite         None          432                 432    tab:blue
    2  6043 (51.6%)    ferrite         None          432                 432  tab:orange
Properties: iq, dp
Scan unit: um
Select by indexed and not indexed data
>>> xmap["indexed"]
Phase  Orientations       Name  Space group  Point group  Proper point group       Color
    1  5657 (48.4%)  austenite         None          432                 432    tab:blue
    2  6043 (51.6%)    ferrite         None          432                 432  tab:orange
Properties: iq, dp
Scan unit: um
>>> xmap["not_indexed"]
No data.
Select with a boolean array (possibly chained)
>>> xmap[xmap.dp > 0.81]
Phase  Orientations       Name  Space group  Point group  Proper point group       Color
    1  4092 (44.8%)  austenite         None          432                 432    tab:blue
    2  5035 (55.2%)    ferrite         None          432                 432  tab:orange
Properties: iq, dp
Scan unit: um
>>> xmap[(xmap.iq > np.mean(xmap.iq)) & (xmap.phase_id == 1)]
Phase  Orientations       Name  Space group  Point group  Proper point group     Color
    1  1890 (100.0%)  austenite         None          432                 432  tab:blue
Properties: iq, dp
Scan unit: um
Attributes
Return whether all points in data are indexed.
Return the column coordinate of each point in the data.
Return the x coordinate step size.
Return the y coordinate step size.
Return the ID of points in data.
Return whether points in data are indexed.
Return the number of data dimensions of points in data.
Return orientations (rotations respecting symmetry), in data.
Return or set the phase IDs of points in data.
Return or set the list of phases.
Return the list of phases in data.
Return the data properties in each data point.
Return the rotations in the data.
Return the number of rotations per data point in data.
Return the shape of
rotations.Return the row coordinate of each point in the data.
Return the shape of points in data.
Return the total number of points in data.
Return the x coordinates of points in data.
Return the y coordinates of points in data.
Methods
Return a deep copy using
copy.deepcopy()function.CrystalMap.empty([shape, step_sizes])Return a crystal map of a given 2D shape and step sizes with identity rotations.
CrystalMap.get_map_data(item[, decimals, ...])Return an array of a class instance attribute, with values equal to
Falseinself.is_in_dataset tofill_value, of map data shape.CrystalMap.plot([value, overlay, scalebar, ...])Plot a 2D map with any crystallographic map property as map values.