Note
Go to the end to download the full example code.
Select and modify data#
This example shows how to select data in a CrystalMap, obtain
a new map from parts of the data and modify data inplace.
- There are five ways to select data:
NumPy slice(s)
By one or more indices
Per phase(s)
Points considered “indexed”/”not_indexed”
Boolean indexing
import matplotlib.pyplot as plt
import numpy as np

from orix.crystal_map import CrystalMap, Phase
from orix.plot import register_projections

register_projections()  # Register our custom Matplotlib projections


def plot_id(xmaps: CrystalMap | list[CrystalMap], titles: str | list[str]) -> None:
    """Convenience function to plot at most four crystal maps showing
    rows, columns and IDs of each map point.
    """
    if isinstance(xmaps, CrystalMap):
        xmaps = [xmaps]
        titles = [titles]
    n_xmaps = len(xmaps)
    if n_xmaps > 2:
        fig_rows, fig_cols = 2, 2
    else:
        fig_rows, fig_cols = 1, len(xmaps)

    fig = plt.figure()
    for i in range(n_xmaps):
        ax = fig.add_subplot(fig_rows, fig_cols, i + 1, projection="plot_map")
        ax.plot_map(xmaps[i], "id", scalebar=False)
        rows, cols = xmaps[i].row, xmaps[i].col
        ax.set_xticks(np.arange(np.max(cols) + 1))
        ax.set_xticklabels(np.arange(np.max(cols) + 1))
        ax.set_yticks(np.arange(np.max(rows) + 1))
        ax.set_yticklabels(np.arange(np.max(rows) + 1))
        ax.set_xlabel("Column")
        ax.set_ylabel("Row")
        ax.set_title(titles[i])
        for j, r, c in zip(xmaps[i].id, rows, cols):
            ax.text(c, r, j, va="center", ha="center", c="r")
    fig.tight_layout()
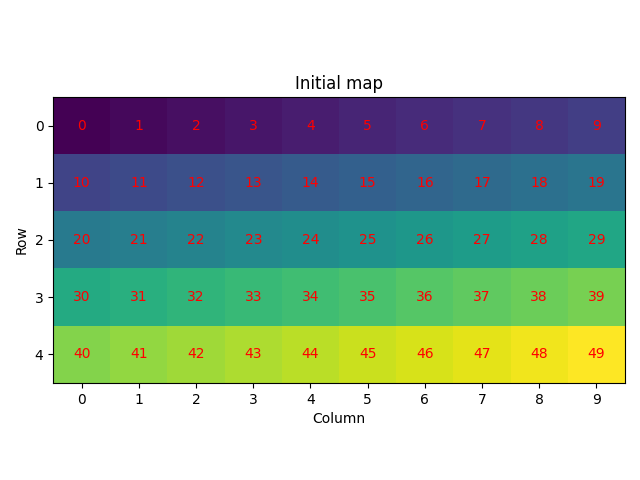
We start by creating a crystal map with five rows and ten columns with all points having one phase and an identity rotation, and plot the row and column coordinates as well as the map ID of each point into the originally created map
xmap = CrystalMap.empty(shape=(5, 10))
xmap.phases[0].name = "a"
print(xmap)

plot_id(xmap, "Initial map")
Phase  Orientations  Name  Space group  Point group  Proper point group     Color
    0   50 (100.0%)     a         None         None                None  tab:blue
Properties:
Scan unit: px
Slice the map (1) by selecting some rows and columns. We’ll plot the IDs again and see that these do not update after slicing. We’ll also select some values from the sliced map (2) by passing one or more indices
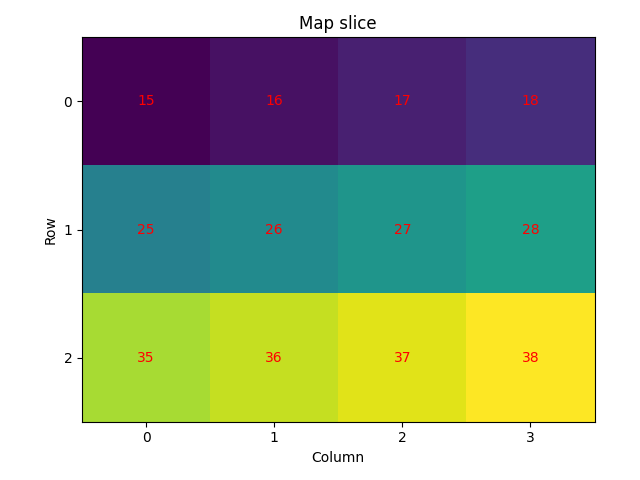
[15]
[35 36 37 38]
[16 26 36]
Select data based on phase(s) (3) after adding a new phase to the phase list and giving some points in the data the new phase ID by modifying the phase IDs inplace
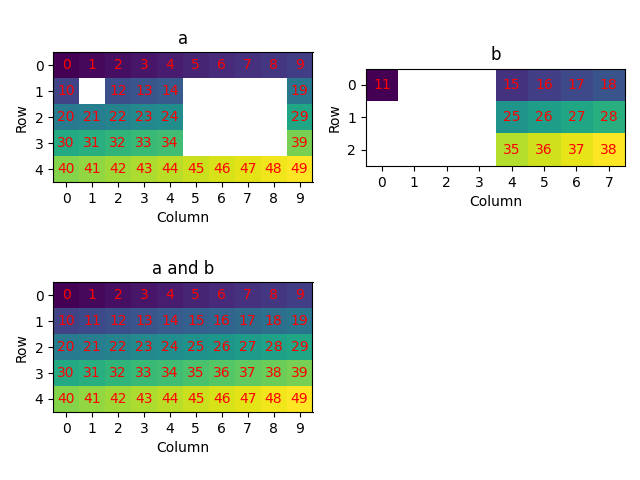
Phase  Orientations  Name  Space group  Point group  Proper point group       Color
    0    37 (74.0%)     a         None         None                None    tab:blue
    1    13 (26.0%)     b         None         None                None  tab:orange
Properties:
Scan unit: px
Set some points to not indexed and select only the indexed data or the not indexed data (4)
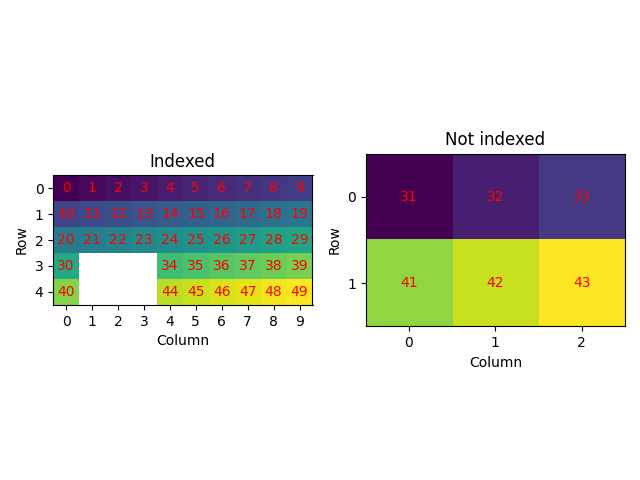
Phase  Orientations         Name  Space group  Point group  Proper point group       Color
   -1     6 (12.0%)  not_indexed         None         None                None       white
    0    31 (62.0%)            a         None         None                None    tab:blue
    1    13 (26.0%)            b         None         None                None  tab:orange
Properties:
Scan unit: px
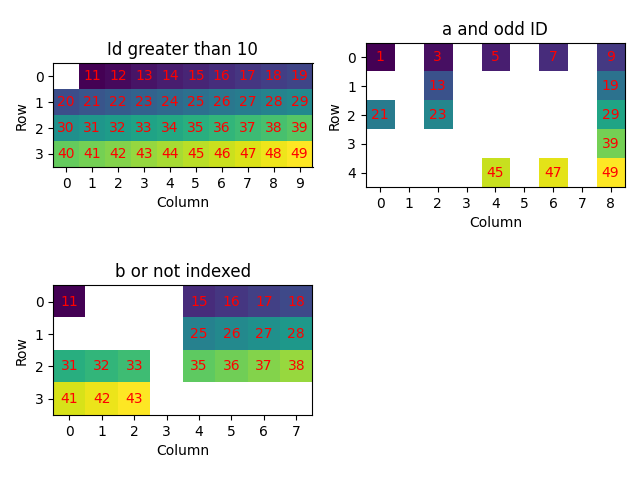
Select data satisfying one or more criteria using boolean arrays (5)
plot_id(
    [
        xmap[xmap.id > 10],
        xmap[(xmap.phase_id == 0) & np.mod(xmap.id, 2).astype(bool)],
        xmap[(xmap.phase_id == 1) | ~xmap.is_indexed],
    ],
    ["Id greater than 10", "a and odd ID", "b or not indexed"],
)
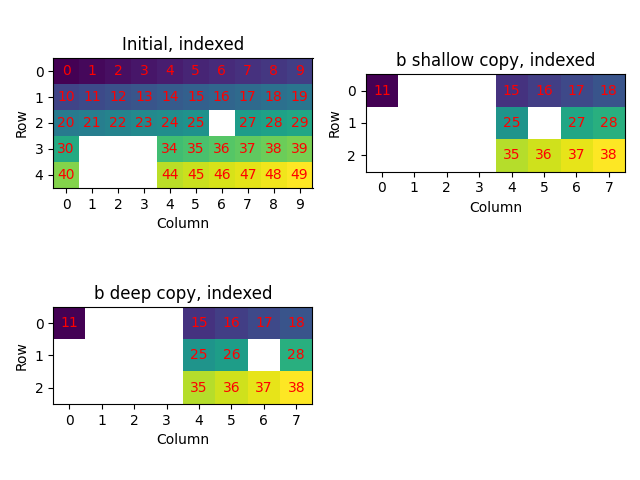
When obtaining a new map from part of another map, the new map is a shallow copy of
the initial map. This means that changes to the new map also changes the initial map.
When this is undesirable, we make a deep copy by calling
deepcopy().
xmap3_shallow = xmap["b"]
xmap3_deep = xmap["b"].deepcopy()

xmap3_shallow[1, 5].phase_id = -1
xmap3_deep[1, 6].phase_id = -1

plot_id(
    [xmap["indexed"], xmap3_shallow["indexed"], xmap3_deep["indexed"]],
    ["Initial, indexed", "b shallow copy, indexed", "b deep copy, indexed"],
)
Total running time of the script: (0 minutes 2.931 seconds)
Estimated memory usage: 548 MB