Crystal map#
In this tutorial we will create, load and save crystallographic mapping data and learn how to access and modify with the data and visualize it. All interactions with this type of data is done with the orix.crystal_map.CrystalMap class.
There are more examples of using crystal maps in the Examples section.
Orientations and other properties acquired from a super-duplex stainless steel (SDSS) EBSD data set with two phases, austenite and ferrite, are used as example data. The data can be downloaded to your local cache via the orix.data module, courtesy of Prof. Jarle Hjelen from the Norwegian University of Science and Technology.
[1]:
%matplotlib inline

import tempfile

from diffpy.structure import Atom, Lattice, Structure
import matplotlib.pyplot as plt
import numpy as np

from orix import data, io, plot
from orix.crystal_map import CrystalMap, Phase, PhaseList
from orix.quaternion import Orientation, Rotation, symmetry
from orix.vector import Vector3d

plt.rcParams.update({"figure.figsize": (7, 7), "font.size": 15})
tempdir = tempfile.mkdtemp() + "/"
Load, create and save#
A CrystalMap instance can be obtained by reading an orientation data set stored in a format supported by orix using the orix.io.load() function, or by passing the necessary arrays when creating the the CrystalMap() method. Three file formats are supported, in addition to orix’s own HDF5 format: Data in the .ang format produced by the softwares EDAX TSL OIM Data Collection v7, NanoMegas
ASTAR Index, and EMsoft v4/v5 via the EMdpmerge program, data in EMsoft v4/v5 HDF5 files produced by the EMEBSDDI program, and data in Bruker’s HDF5 files resulting from Hough indexing.
Two writers are supported, namely orix’s own HDF5 format, readable by orix and any HDF5 file viewer, and the .ang format, readable at least by MTEX and EDAX TSL OIM Analysis v7.
Load or create#
Let’s load a small crystal map from an .ang file produced with EMsoft. We have to explicitly allow download from an external source.
[2]:
xmap = data.sdss_ferrite_austenite(allow_download=True)
xmap
/home/docs/checkouts/readthedocs.org/user_builds/orix/conda/stable/lib/python3.11/site-packages/tqdm/auto.py:21: TqdmWarning: IProgress not found. Please update jupyter and ipywidgets. See https://ipywidgets.readthedocs.io/en/stable/user_install.html
  from .autonotebook import tqdm as notebook_tqdm
[2]:
Phase   Orientations       Name  Space group  Point group  Proper point group       Color
    1   5657 (48.4%)  austenite         None          432                 432    tab:blue
    2   6043 (51.6%)    ferrite         None          432                 432  tab:orange
Properties: iq, dp
Scan unit: um
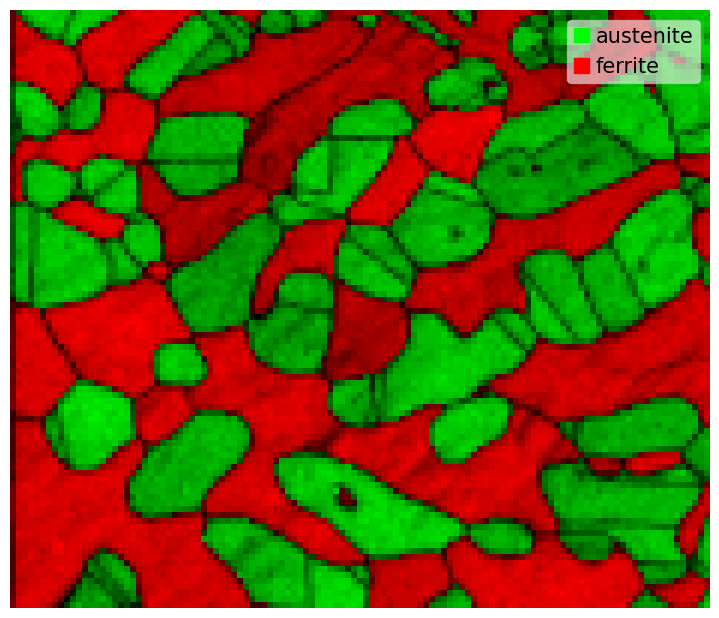
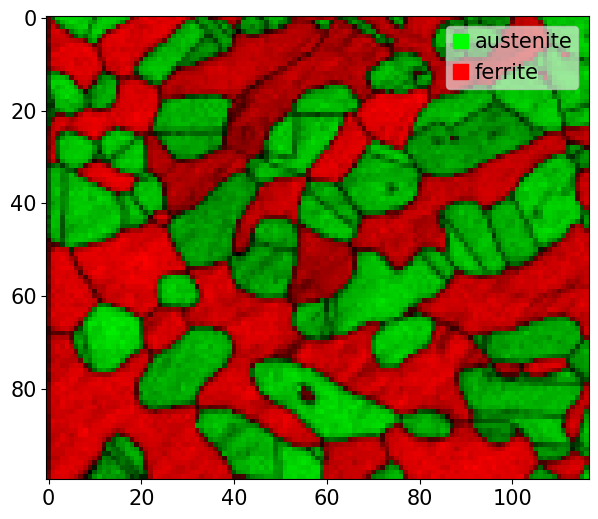
Let’s inspect the data and plot it
[3]:
xmap.plot(
    overlay="dp"
)  # Dot product values added to the alpha (RGBA) channel
xmap
[3]:
Phase   Orientations       Name  Space group  Point group  Proper point group       Color
    1   5657 (48.4%)  austenite         None          432                 432    tab:blue
    2   6043 (51.6%)    ferrite         None          432                 432  tab:orange
Properties: iq, dp
Scan unit: um
The indexing properties returned by EMsoft in their .ang files are the pattern image quality (iq) (according to Niels Krieger Lassen’s method), and the highest normalized dot product (dp) between the experimental and best matching simulated pattern.
The same CrystalMap object can be obtained by reading each array from the .ang file ourselves and passing this to CrystalMap.__init__()
[4]:
# Directly access *private* cache data path from module
from orix.data._data import _fetcher

_target = _fetcher.path / "sdss/sdss_ferrite_austenite.ang"

# Read each column from the file
eu1, eu2, eu3, x, y, iq, dp, phase_id = np.loadtxt(_target, unpack=True)

# Create a Rotation object from Euler angles
euler_angles = np.column_stack((eu1, eu2, eu3))
rotations = Rotation.from_euler(euler_angles)

# Create a property dictionary
properties = dict(iq=iq, dp=dp)

# Create unit cells of the phases
structures = [
    Structure(
        title="austenite",
        atoms=[Atom("fe", [0] * 3)],
        lattice=Lattice(0.360, 0.360, 0.360, 90, 90, 90),
    ),
    Structure(
        title="ferrite",
        atoms=[Atom("fe", [0] * 3)],
        lattice=Lattice(0.287, 0.287, 0.287, 90, 90, 90),
    ),
]
phase_list = PhaseList(
    names=["austenite", "ferrite"],
    point_groups=["432", "432"],
    structures=structures,
)

# Create a CrystalMap instance
xmap2 = CrystalMap(
    rotations=rotations,
    phase_id=phase_id,
    x=x,
    y=y,
    phase_list=phase_list,
    prop=properties,
)
xmap2.scan_unit = "um"

xmap2
[4]:
Phase   Orientations       Name  Space group  Point group  Proper point group       Color
    1   5657 (48.4%)  austenite         None          432                 432    tab:blue
    2   6043 (51.6%)    ferrite         None          432                 432  tab:orange
Properties: iq, dp
Scan unit: um
Save#
orix HDF5 format#
As mentioned, the two writers implemented are orix’s own HDF5 format and the .ang format, used by calling orix.io.save()
[5]:
Read the file contents back into a CrystalMap object using orix.io.load() function.
All contents in this file can be inspected using any HDF5 viewer and read back into Python using the h5py library (which we use).
.ang format#
The .ang writer supports many use cases. Some of these are demonstrated here, by reloading the saved crystal maps.
First, let’s write the multi phase map to an .ang file, specifying that the xmap.dp property should be written to the confidence index (CI) column
[6]:
fname_ang1 = "sdss_dp_ci.ang"
io.save(
    filename=tempdir + fname_ang1,
    object2write=xmap,
    confidence_index_prop="dp",
)

xmap_reload1 = io.load(tempdir + fname_ang1)
print(xmap_reload1)
print(xmap_reload1.prop)
autogenerating phase names...
Changing Phase 1 name from 'austenite' to 'austenite'
Changing Phase 2 name from 'ferrite' to 'ferrite'
Phase   Orientations       Name  Space group  Point group  Proper point group       Color
    1   5657 (48.4%)  austenite         None          432                 432  tab:orange
    2   6043 (51.6%)    ferrite         None          432                 432    tab:blue
Properties: iq, ci, detector_signal, fit
Scan unit: um
{'iq': array([24.4, 24. , 30.3, ..., 25.3, 25.8, 31.7], shape=(11700,)), 'ci': array([0.799, 0.797, 0.825, ..., 0.817, 0.809, 0.828], shape=(11700,)), 'detector_signal': array([0., 0., 0., ..., 0., 0., 0.], shape=(11700,)), 'fit': array([0., 0., 0., ..., 0., 0., 0.], shape=(11700,))}
Note that points not in data are set to not_indexed when reloaded from the .ang file, and that all properties in points not in the data set are set to zero, except for the CI column where this property in points not in the data (the austenite points) are set to -1, which MTEX and EDAX TSL expects in these points.
Finally, it is worth mentioning that if a map has more than one rotation/match and phase ID per point, the index parameter can be passed to write any “layer” of the data to file.
Modify crystal phases#
The phases are stored in a PhaseList instance in the CrystalMap.phases attribute
[7]:
xmap.phases
[7]:
Id       Name  Space group  Point group  Proper point group       Color
 1  austenite         None          432                 432    tab:blue
 2    ferrite         None          432                 432  tab:orange
Symmetry#
The point group symmetry are stored in the vendor and EMsoft files, however they provide no space group symmetry. We can set this per phase by providing a space group number (1-230) according to the International Tables of Crystallography (useful link: http://img.chem.ucl.ac.uk/sgp/large/sgp.htm)
[8]:
xmap.phases[1].space_group = 225
xmap.phases[2].space_group = 229

xmap.phases
[8]:
Id       Name  Space group  Point group  Proper point group       Color
 1  austenite        Fm-3m         m-3m                 432    tab:blue
 2    ferrite        Im-3m         m-3m                 432  tab:orange
Note that this also changed the point group, because this is always determined from the space group. But the proper point group, without any inversion or mirror planes, stayed the same. The space_group attribute stores a diffpy.structure.spacegroups.SpaceGroup instance.
We can get the point group which a space group is the subgroup of
[9]:
print(symmetry.get_point_group(200).name, symmetry.get_point_group(230).name)
m-3 m-3m
The point group stores symmetry operations as quaternions. We can get them as orientation matrices
[10]:
xmap.phases[1].point_group[:2]
[10]:
Symmetry (2,)
[[1.     0.     0.     0.    ]
 [0.7071 0.     0.     0.7071]]
[11]:
xmap.phases[1].point_group[:2].to_matrix()
[11]:
array([[[ 1.00000000e+00,  0.00000000e+00,  0.00000000e+00],
        [ 0.00000000e+00,  1.00000000e+00,  0.00000000e+00],
        [ 0.00000000e+00,  0.00000000e+00,  1.00000000e+00]],

       [[-4.26642159e-17, -1.00000000e+00,  0.00000000e+00],
        [ 1.00000000e+00, -4.26642159e-17,  0.00000000e+00],
        [ 0.00000000e+00,  0.00000000e+00,  1.00000000e+00]]])
diffpy.structure stores rotation symmetry operations as orientation matrices and translations as 1D arrays
[12]:
[(i.R, i.t) for i in xmap.phases[1].space_group.symop_list[:2]]
[12]:
[(array([[1., 0., 0.],
         [0., 1., 0.],
         [0., 0., 1.]]),
  array([0., 0., 0.])),
 (array([[-1.,  0.,  0.],
         [ 0., -1.,  0.],
         [ 0.,  0.,  1.]]),
  array([0., 0., 0.]))]
We can get the quaternion representation of these matrices
[13]:
[
    Rotation.from_matrix(i.R)
    for i in xmap.phases[1].space_group.symop_list[:2]
]
[13]:
[Rotation (1,)
 [[1. 0. 0. 0.]],
 Rotation (1,)
 [[0. 0. 0. 1.]]]
Index phase list#
The phase list can be indexed by phase ID or name
[14]:
xmap.phases[1]
[14]:
<name: austenite. space group: Fm-3m. point group: m-3m. proper point group: 432. color: tab:blue>
[15]:
xmap.phases["austenite"]
[15]:
<name: austenite. space group: Fm-3m. point group: m-3m. proper point group: 432. color: tab:blue>
[16]:
xmap.phases[1:]
[16]:
Id       Name  Space group  Point group  Proper point group       Color
 1  austenite        Fm-3m         m-3m                 432    tab:blue
 2    ferrite        Im-3m         m-3m                 432  tab:orange
[17]:
xmap.phases["austenite", "ferrite"]
[17]:
Id       Name  Space group  Point group  Proper point group       Color
 1  austenite        Fm-3m         m-3m                 432    tab:blue
 2    ferrite        Im-3m         m-3m                 432  tab:orange
When asking for a single phase, either by an integer or a single string, a Phase instance was returned. In the other cases, a PhaseList object was returned
<class 'orix.crystal_map._phase.Phase'> <class 'orix.crystal_map._phase_list.PhaseList'>
Valid point group names to use when setting the point group symmetry are
[19]:
[point_group.name for point_group in symmetry._groups]
[19]:
['1',
 '-1',
 '211',
 '121',
 '112',
 'm11',
 '1m1',
 '11m',
 '2/m',
 '222',
 'mm2',
 'mmm',
 '4',
 '-4',
 '4/m',
 '422',
 '4mm',
 '-42m',
 '4/mmm',
 '3',
 '-3',
 '321',
 '312',
 '32',
 '3m',
 '-3m',
 '6',
 '-6',
 '6/m',
 '622',
 '6mm',
 '-6m2',
 '6/mmm',
 '23',
 'm-3',
 '432',
 '-43m',
 'm-3m']
[20]:
xmap.phases["austenite"].point_group = "-43m"

xmap.phases
/home/docs/checkouts/readthedocs.org/user_builds/orix/conda/stable/lib/python3.11/site-packages/orix/crystal_map/_phase.py:255: UserWarning: Setting space group to 'None', as current space group 'Fm-3m' is derived from current point group 'm-3m'
  warnings.warn(
[20]:
Id       Name  Space group  Point group  Proper point group       Color
 1  austenite         None         -43m                  23    tab:blue
 2    ferrite        Im-3m         m-3m                 432  tab:orange
Note that the space_group was set to None since space group Fm-3m is not a subgroup of -43m.
Let’s revert to the correct space group (and the name, for convenience)
[21]:
xmap.phases["austenite"].space_group = 225

xmap.phases
[21]:
Id       Name  Space group  Point group  Proper point group       Color
 1  austenite        Fm-3m         m-3m                 432    tab:blue
 2    ferrite        Im-3m         m-3m                 432  tab:orange
We can add a phase by giving its name and point group symmetry
[22]:
xmap.phases.add(Phase("sigma", point_group="4/mmm"))

xmap.phases
[22]:
Id       Name  Space group  Point group  Proper point group       Color
 1  austenite        Fm-3m         m-3m                 432    tab:blue
 2    ferrite        Im-3m         m-3m                 432  tab:orange
 3      sigma         None        4/mmm                 422   tab:green
When adding a phase to the phase list like this, the phases’ structure contains no atoms and the default lattice parameters are used
[23]:
xmap.phases["sigma"].structure.lattice.abcABG()
[23]:
(1.0, 1.0, 1.0, 90.0, 90.0, 90.0)
So let’s set this
[24]:
Lattice(a=0.88, b=0.88, c=0.88, alpha=90, beta=90, gamma=90)
If some data points are considered as not indexed, a “not_indexed” phase can be added to the phase list to keep track of these points
[25]:
xmap.phases.add_not_indexed()

xmap.phases
[25]:
Id         Name  Space group  Point group  Proper point group       Color
-1  not_indexed         None         None                None       white
 1    austenite        Fm-3m         m-3m                 432    tab:blue
 2      ferrite        Im-3m         m-3m                 432  tab:orange
 3        sigma         None        4/mmm                 422   tab:green
No points in this data set are considered not indexed. A phase list with only the phases in the data is stored in the phases_in_data attribute
[26]:
xmap.phases_in_data
[26]:
Id       Name  Space group  Point group  Proper point group       Color
 1  austenite        Fm-3m         m-3m                 432    tab:blue
 2    ferrite        Im-3m         m-3m                 432  tab:orange
We can of course remove a phase from the phase list, either by its name or phase ID
[27]:
del xmap.phases["sigma"]
del xmap.phases[-1]

xmap.phases
[27]:
Id       Name  Space group  Point group  Proper point group       Color
 1  austenite        Fm-3m         m-3m                 432    tab:blue
 2    ferrite        Im-3m         m-3m                 432  tab:orange
Properties#
The phase name, space group, point group, proper point group, color and structure can be accessed for the full phase list or a single phase
[28]:
['austenite', 'ferrite']
['Fm-3m', 'Im-3m']
['m-3m', 'm-3m']
['432', '432']
['tab:blue', 'tab:orange']
[[], []]
Note that the structures’ representations are empty lists since no atoms have been added to them yet.
[29]:
xmap.phases["austenite"]
print(xmap.phases["austenite"].name)
print(xmap.phases["austenite"].space_group.short_name)
print(xmap.phases["austenite"].point_group.name)
print(xmap.phases["austenite"].point_group.proper_subgroup.name)
print(xmap.phases["austenite"].color)
print(xmap.phases["austenite"].structure)
austenite
Fm-3m
m-3m
432
tab:blue
lattice=Lattice(a=3.595, b=3.595, c=3.595, alpha=90, beta=90, gamma=90)
These attributes (not the phase ID) can be set per phase
[30]:
lattice=Lattice(a=0.36, b=0.36, c=0.36, alpha=90, beta=90, gamma=90)

(0.0, 1.0, 0.0)
[30]:
Id       Name  Space group  Point group  Proper point group       Color
 1  austenite        Fm-3m         m-3m                 432        lime
 2    ferrite        Im-3m         m-3m                 432  tab:orange
Valid color strings can be found here: https://matplotlib.org/stable/tutorials/colors/colors.html
Create phase list#
We can create a phase list using PhaseList
[31]:
PhaseList(
    names=["al", "cu"],
    space_groups=[225, 225],
    colors=["lime", "xkcd:violet"],
    ids=[0, 1],
    structures=[
        Structure(
            atoms=[Atom("al", [0] * 3)],
            lattice=Lattice(0.405, 0.405, 0.405, 90, 90, 90),
        ),
        Structure(
            atoms=[Atom("cu", [0] * 3)],
            lattice=Lattice(0.361, 0.361, 0.361, 90, 90, 90),
        ),
    ],
)
[31]:
Id  Name  Space group  Point group  Proper point group        Color
 0    al        Fm-3m         m-3m                 432         lime
 1    cu        Fm-3m         m-3m                 432  xkcd:violet
or by creating Phase objects and passing these to the first argument in PhaseList.__init__() as a list (or single Phase objects)
[32]:
[32]:
Id  Name  Space group  Point group  Proper point group       Color
 0    al        Fm-3m         m-3m                 432    tab:blue
 1    cu         None         None                None  tab:orange
Note that the Cu phase name was retrieved from the Structure object.
Copying#
If we want a shallow copy of the phase list
[33]:
pl = xmap.phases
pl["ferrite"].color = "red"

xmap.phases
[33]:
Id       Name  Space group  Point group  Proper point group  Color
 1  austenite        Fm-3m         m-3m                 432   lime
 2    ferrite        Im-3m         m-3m                 432    red
If we want a deep copy of the phase list
[34]:
Id       Name  Space group  Point group  Proper point group     Color
 1  austenite        Fm-3m         m-3m                 432      lime
 2    ferrite        Im-3m         m-3m                 432       red
 3        chi         None         -43m                  23  tab:blue

Id       Name  Space group  Point group  Proper point group  Color
 1  austenite        Fm-3m         m-3m                 432   lime
 2    ferrite        Im-3m         m-3m                 432    red
Orientation data#
Rotations are stored in a Rotation instance
[35]:
xmap.rotations
[35]:
Rotation (11700,)
[[ 0.9358  0.3191  0.0919 -0.1185]
 [ 0.8686  0.3569 -0.2749 -0.2064]
 [ 0.8681  0.3581 -0.2744 -0.2068]
 ...
 [ 0.9126 -0.3022 -0.1552  0.2275]
 [ 0.8854  0.3337 -0.2385  0.2187]
 [ 0.885   0.3341 -0.2391  0.2193]]
Orientations per phase can be obtained by applying the phase point group symmetry
[36]:
O_au = xmap["austenite"].orientations

O_au
[36]:
Orientation (5657,) m-3m
[[ 0.8686  0.3569 -0.2749 -0.2064]
 [ 0.8681  0.3581 -0.2744 -0.2068]
 [ 0.8684  0.3578 -0.2751 -0.2052]
 ...
 [ 0.9639  0.022   0.0754 -0.2545]
 [ 0.8854  0.3337 -0.2385  0.2187]
 [ 0.885   0.3341 -0.2391  0.2193]]
The above is equivalent to
[37]:
R_au = xmap["austenite"].rotations
O_au2 = Orientation(R_au, symmetry=xmap["austenite"].phases[1].point_group)
Orientation angles and axes are readily available
[38]:
O_au.angle
[38]:
array([1.03696736, 1.0386825 , 1.03750937, ..., 0.53910283, 0.96693885,
       0.96880627], shape=(5657,))
[39]:
O_au.axis
[39]:
Vector3d (5657,)
[[ 0.7202 -0.5548 -0.4166]
 [ 0.7215 -0.5529 -0.4167]
 [ 0.7217 -0.5549 -0.4139]
 ...
 [ 0.0826  0.283  -0.9556]
 [ 0.7179 -0.5131  0.4705]
 [ 0.7174 -0.5135  0.4708]]
Map properties#
Map properties are stored in the CrystalMap.prop attribute dictionary
[40]:
xmap.prop
[40]:
{'iq': array([24.4, 24. , 30.3, ..., 25.3, 25.8, 31.7], shape=(11700,)),
 'dp': array([0.799, 0.797, 0.825, ..., 0.817, 0.809, 0.828], shape=(11700,))}
All properties in this dictionary are also available directly from the CrystalMap as attributes
[41]:
xmap.iq
[41]:
array([24.4, 24. , 30.3, ..., 25.3, 25.8, 31.7], shape=(11700,))
[42]:
xmap.dp
[42]:
array([0.799, 0.797, 0.825, ..., 0.817, 0.809, 0.828], shape=(11700,))
We can add a map property by specifying its name and an initial value in each map point
[43]:
xmap.prop["grain_boundary"] = 0

xmap.grain_boundary
[43]:
array([0, 0, 0, ..., 0, 0, 0], shape=(11700,))
[44]:
array([ 0, 1, 2, ..., 11697, 11698, 11699], shape=(11700,))
We can also delete a property from the prop dictionary
[45]:
del xmap.prop["grain_boundary2"]

xmap.prop
[45]:
{'iq': array([24.4, 24. , 30.3, ..., 25.3, 25.8, 31.7], shape=(11700,)),
 'dp': array([0.799, 0.797, 0.825, ..., 0.817, 0.809, 0.828], shape=(11700,)),
 'grain_boundary': array([0, 0, 0, ..., 0, 0, 0], shape=(11700,))}
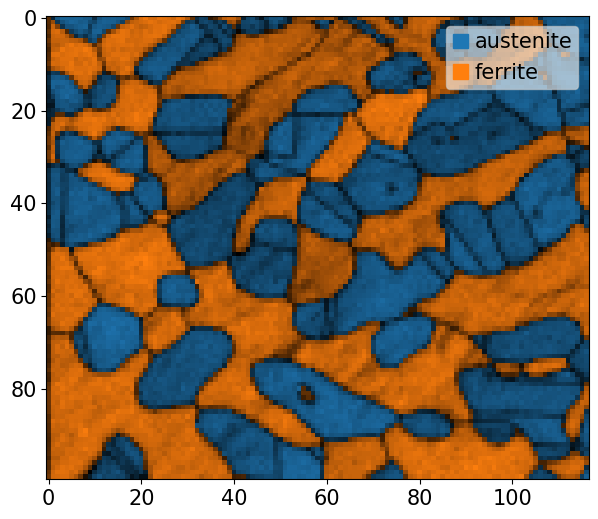
Plotting#
Map plotting can either be done via the CrystalMap.plot() method, or via the CrystalMapPlot matplotlib projection. To plot a phase map via CrystalMap.plot(), we simply do
[46]:
xmap.plot()
Using the matplotlib projection
[47]:
# fig, ax = plt.subplots(subplot_kw=dict(projection="plot_map"))
# im = ax.plot_map(xmap)
Hover over figure points to display the (x,y) position and orientations in that point when plotting interactively!
Note that plot() wraps matplotlib.axes.Axes.imshow. All key word arguments in plot() are passed to imshow(), so be sure to check its documentation out for any additional arguments.
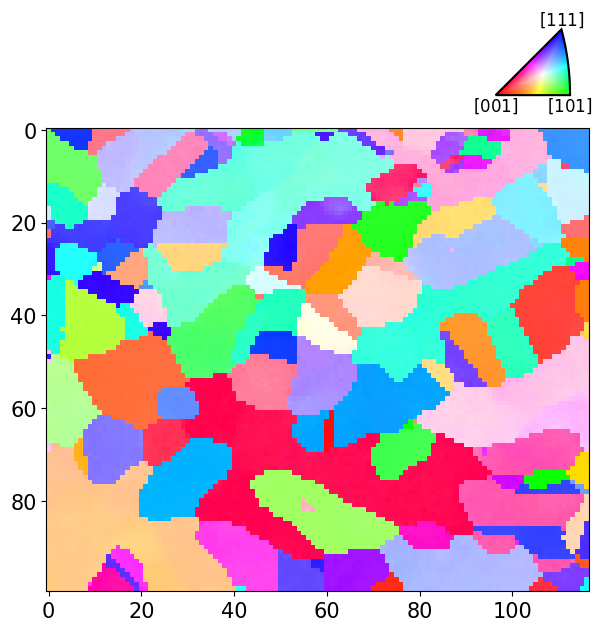
If we obtain a colour per orientation using IPFColorKeyTSL.orientation2color() (see also the inverse pole figure tutorial), we can plot this as well
[48]:
And the combined plot with the IPF color key added to the figure:
[51]:
rgb_all = np.zeros((xmap.size, 3))
rgb_all[xmap.phase_id == 1] = rgb_au
rgb_all[xmap.phase_id == 2] = rgb_fe

fig = xmap.plot(rgb_all, return_figure=True)

rc = {"font.size": 8}
with plt.rc_context(rc):  # Temporarily reduce font size
    ax_ipfkey = fig.add_axes(
        [0.72, 0.87, 0.2, 0.1],
        projection="ipf",
        symmetry=xmap.phases["austenite"].point_group,
    )
    ax_ipfkey.plot_ipf_color_key()
    ax_ipfkey.set_title("")
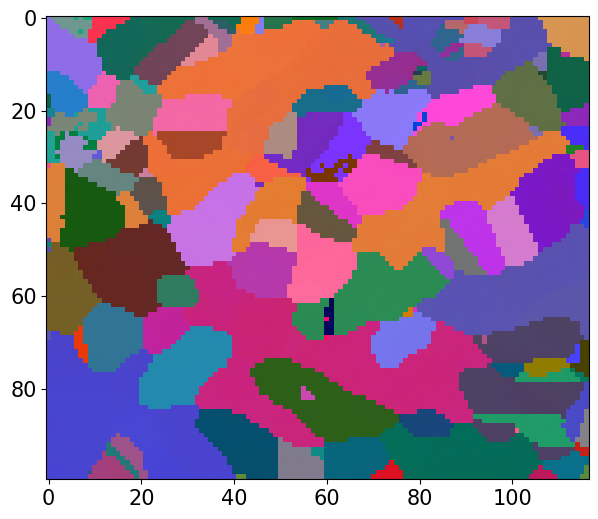
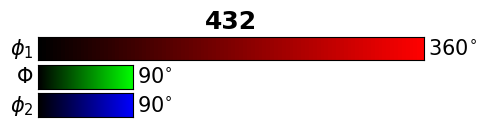
We can also color orientations from their Euler angles using EulerColorKey.orientation2color()
[52]:
ckey_euler = plot.EulerColorKey(xmap.phases["austenite"].point_group)
rgb_au_euler = ckey_euler.orientation2color(xmap["austenite"].orientations)
rgb_fe_euler = ckey_euler.orientation2color(xmap["ferrite"].orientations)
[53]:
rgb_all_euler = np.zeros((xmap.size, 3))
rgb_all_euler[xmap.phase_id == 1] = rgb_au_euler
rgb_all_euler[xmap.phase_id == 2] = rgb_fe_euler

xmap.plot(rgb_all_euler)
We can plot the color key to see the fundamental Euler region for point group 432
[54]:
ckey_euler.plot()
We can add any overlay, from any property with a value in each map point, to the map by either passing the property name as a string, or the actual (flattened) array
[55]:
xmap.plot(overlay=xmap.dp)
To save our phase map with the scalebar and legend, but without white padding
[56]:
fig = xmap.plot(overlay="dp", return_figure=True, remove_padding=True)
fig.savefig(tempdir + "phase_map.png", bbox_inches="tight", pad_inches=0)

To save phase map without a scalebar, legend and white padding, and one image pixel per map point
[57]:
ax = fig.axes[0]
ax
[57]:
<CrystalMapPlot: >
[58]:
# 2D NumPy array, possibly with an RGB tuple in each element
plt.imsave(tempdir + "phase_map_no_fluff.png", arr=ax.images[0].get_array())
We can plot any property with a value in each map point, also adding a colorbar
[59]:
fig = xmap.plot(
    xmap.dp,
    cmap="inferno",
    colorbar=True,
    colorbar_label="Dottproduct",
    return_figure=True,
)
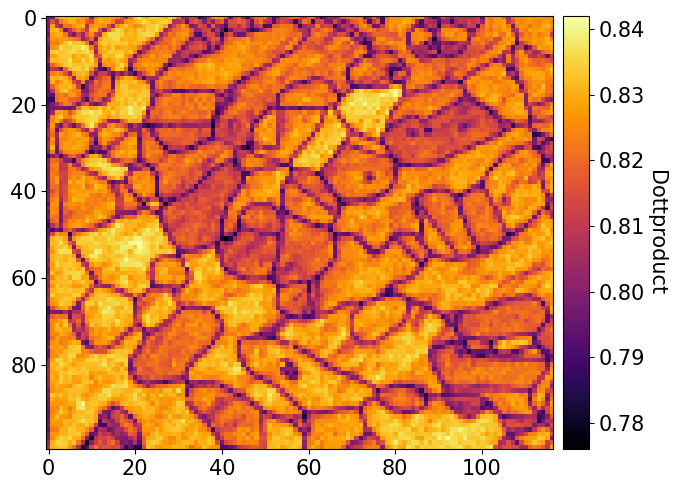
We can update the colorbar
[60]:
cbar = fig.axes[0].colorbar
cbar
[60]:
<matplotlib.colorbar.Colorbar at 0x7919c08146d0>
[61]:
cbar.ax.set_ylabel("Dot product");
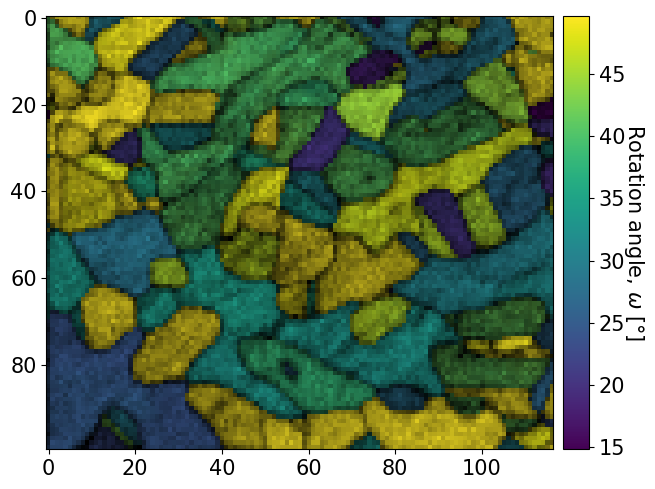
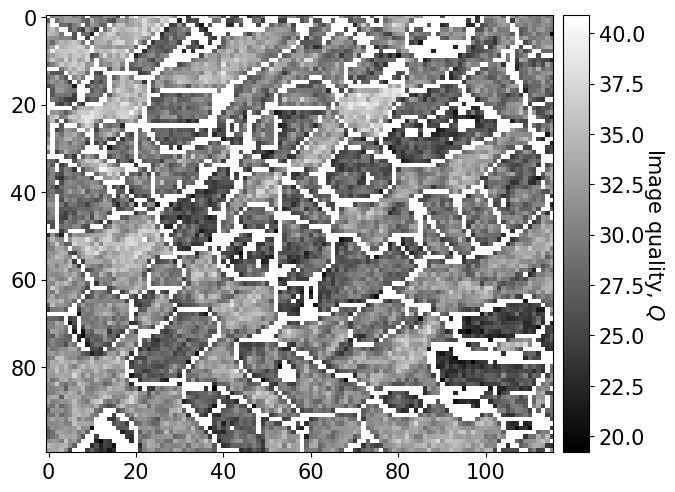
We can also plot orientation related values, like axis and angles etc., and restrict the color bar maximum
[62]:
# Get rotation angles in degrees
angles = xmap.rotations.angle * 180 / np.pi

xmap.plot(
    angles,
    vmax=angles.max() - 10,
    overlay=xmap.iq,
    colorbar=True,
    colorbar_label=r"Rotation angle, $\omega$ [$\degree$]",
)
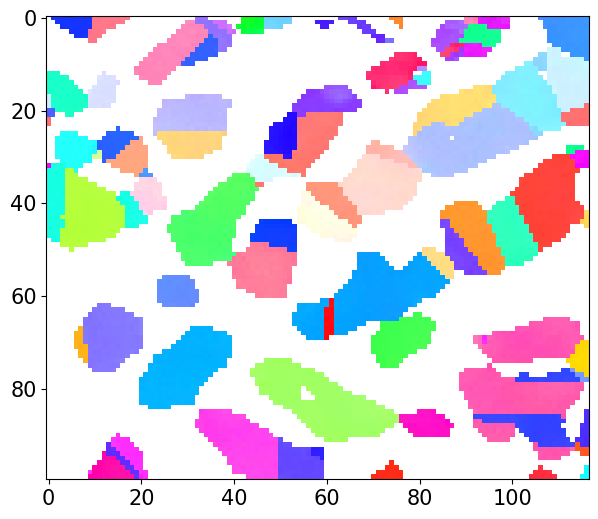
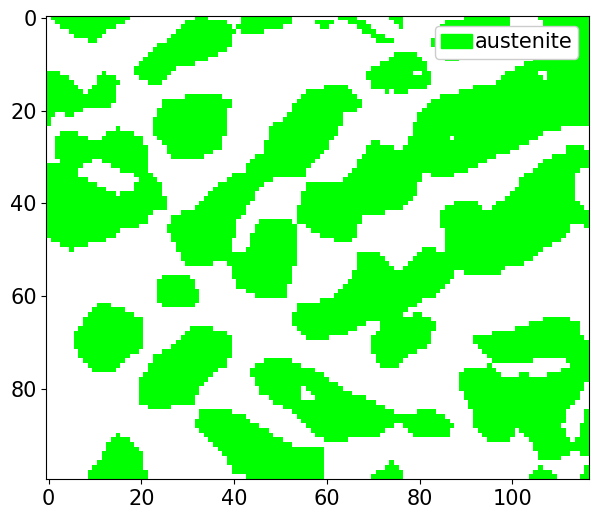
To plot only one phase, while passing custom
scalebar properties (ppinard/matplotlib-scalebar)
legend properties (https://matplotlib.org/stable/api/_as_gen/matplotlib.pyplot.legend.html)
[63]:
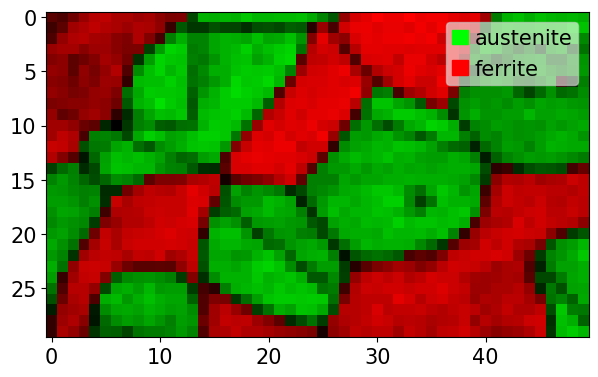
Plot only a rectangle of the map
[64]:
xmap2 = xmap[20:50, 40:90]
xmap2.plot(overlay=xmap2.dp)
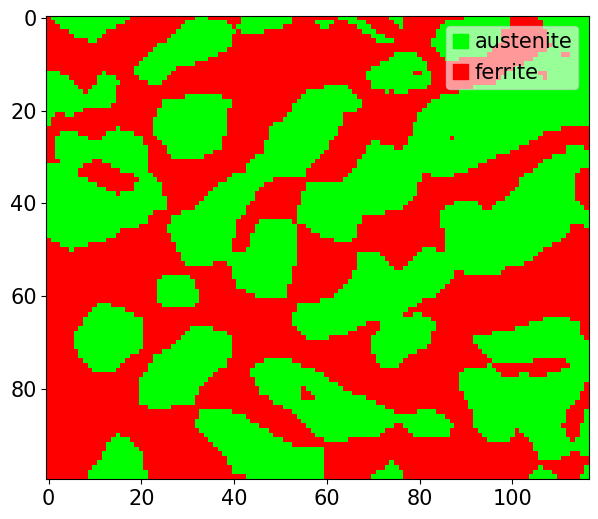
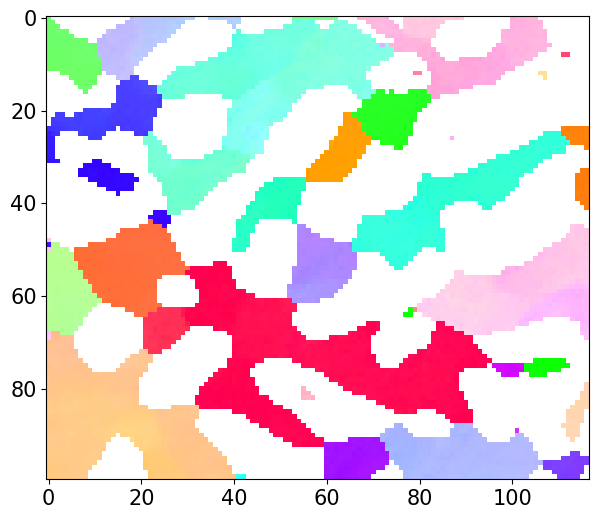
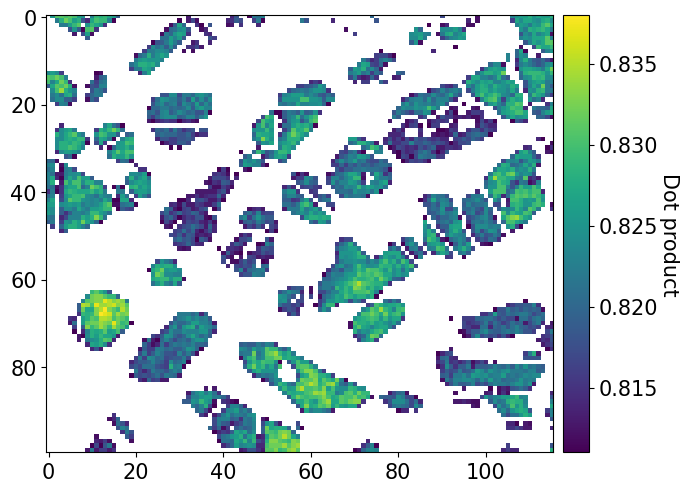
Plot only parts of a map based on chained conditionals, like belonging to one phase or having a property value above a threshold
[65]:
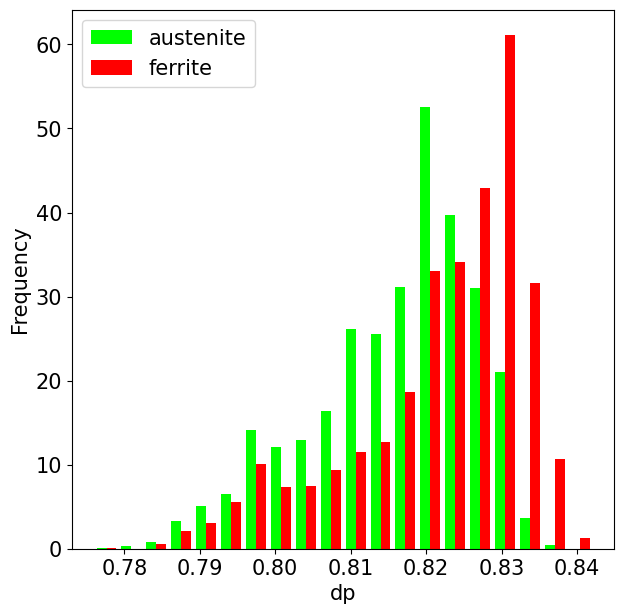
Plot histogram of a property per phase
[66]:
# Property of interest
this_prop = "dp"

# Plot phase map again to see color changes
xmap.plot(overlay=this_prop, remove_padding=True)

# Declare lists for plotting
data = []
labels = []
colors = []

# Get property values, name and color per phase
for _, p in xmap.phases_in_data:
    labels.append(p.name)
    colors.append(p.color)

    # Accessing the property dictionary directly
    data.append(xmap[p.name].prop[this_prop])
    # or indirectly
    # data.append(xmap[p.name].dp)

# Nice bar plot with property histogram per phase
fig, ax = plt.subplots()
ax.hist(
    data, bins=20, histtype="bar", density=True, label=labels, color=colors
)
ax.set_xlabel(this_prop)
ax.set_ylabel("Frequency")
ax.legend();