Note
Go to the end to download the full example code.
Combining rotations#
This example demonstrates how to combine two rotations \(R_1\) and \(R_2\), i.e. from right to left like so
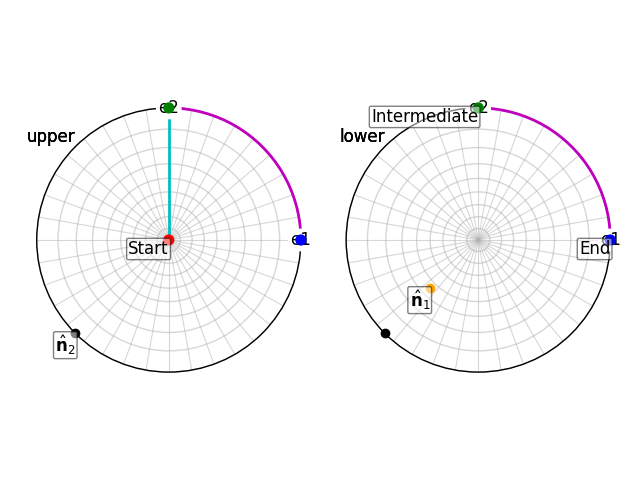
To convince ourselves that this order is correct, we rotate a vector \(\mathbf{v} = (0, 0, z)\) by two rotations: rotation \(R_1\) by \(120^{\circ}\) around \([1 1 1]\) followed by rotation \(R_2\) by \(180^{\circ}\) around \([1 1 0]\). Rotation \(R_1\) is carried out first, followed by rotation \(R_2\).
Note that a negative angle \(\omega\) when defining a rotation in the axis-angle representation \((\hat{\mathbf{n}}, \omega)\) is necessary for consistent transformations between rotation representations.
R1, R2 and R12:
* As quaternions:
 Rotation (3,)
[[ 0.5    -0.5    -0.5    -0.5   ]
 [ 0.     -0.7071 -0.7071 -0.    ]
 [-0.7071 -0.     -0.7071 -0.    ]]
* As orientation matrices:
 [[[ 0.  1. -0.]
  [-0.  0.  1.]
  [ 1. -0.  0.]]

 [[ 0.  1. -0.]
  [ 1.  0.  0.]
  [ 0. -0. -1.]]

 [[-0.  0.  1.]
  [ 0.  1. -0.]
  [-1.  0. -0.]]]
Point rotated by R12:
 [0.0, 0.0, 1.0] -> [1.0, -0.0, -0.0]
import matplotlib.pyplot as plt

from orix.plot import register_projections
from orix.quaternion import Rotation
from orix.vector import Vector3d

plt.rcParams.update({"font.size": 12, "grid.alpha": 0.5})

register_projections()  # Register our custom Matplotlib projections

R1 = Rotation.from_axes_angles([1, 1, 1], -120, degrees=True)
R2 = Rotation.from_axes_angles([1, 1, 0], -180, degrees=True)
R12 = R2 * R1

R_all = Rotation.stack([R1, R2, R12]).squeeze()
print("R1, R2 and R12:\n* As quaternions:\n", R_all)
print("* As orientation matrices:\n", R_all.to_matrix().squeeze().round(10))

v_start = Vector3d.zvector()
v_end = R12 * v_start
print(
    "Point rotated by R12:\n",
    v_start.data.squeeze().tolist(),
    "->",
    v_end.data.squeeze().round(10).tolist(),
)

# Illustrate the steps of the rotation by plotting the vector before
# (red), during (green), and after (blue) the rotation and the rotation
# paths (first: cyan; second: magenta)
v_intermediate = R1 * v_start

v_si_path = Vector3d.from_path_ends(Vector3d.stack([v_start, v_intermediate]))
v_sie_path = Vector3d.from_path_ends(Vector3d.stack([v_intermediate, v_end]))

fig = plt.figure(layout="tight")
ax0 = fig.add_subplot(121, projection="stereographic")
ax1 = fig.add_subplot(122, projection="stereographic", hemisphere="lower")
ax0.stereographic_grid(), ax1.stereographic_grid()
Vector3d.stack([v_start, v_intermediate, v_end]).scatter(
    figure=fig,
    s=50,
    c=["r", "g", "b"],
    axes_labels=["e1", "e2"],
)
ax0.plot(v_si_path, color="c"), ax1.plot(v_si_path, color="c")
ax0.plot(v_sie_path, color="m"), ax1.plot(v_sie_path, color="m")
R1.axis.scatter(figure=fig, c="orange")
R2.axis.scatter(figure=fig, c="k")
text_kw = {
    "bbox": {"alpha": 0.5, "fc": "w", "boxstyle": "round,pad=0.1"},
    "ha": "right",
    "va": "top",
}
ax0.text(v_start, s="Start", **text_kw)
ax1.text(v_intermediate, s="Intermediate", **text_kw)
ax1.text(v_end, s="End", **text_kw)
ax1.text(R1.axis, s=r"$\hat{\mathbf{n}}_1$", **text_kw)
ax0.text(R2.axis, s=r"$\hat{\mathbf{n}}_2$", **text_kw)
Total running time of the script: (0 minutes 0.564 seconds)
Estimated memory usage: 542 MB