Sampling unit vectors#
Sampling unit vectors or directions in 3D space is equivalent to sampling points on the surface of the unit sphere (\(S_2\)). There are multiple use cases for discretizing and sampling this space, for example for creating custom legends for inverse pole figure maps or for creating a list of unique crystal directions. Except for the platonic solids, it is not possible to sample the sphere surface such that each vector has an identical neighborhood, i.e. equal angles between nearest neighbors. A number of sampling or “meshing” techniques exist, a number of which have been implemented in orix.sampling.sample_S2() and demonstrated in this tutorial.
[1]:
%matplotlib inline

import matplotlib.pyplot as plt

from orix import plot
from orix.quaternion import symmetry
from orix.sampling import sample_S2_methods, sample_S2

plt.rcParams.update({"font.size": 20, "lines.markersize": 2})
Sampling methods#
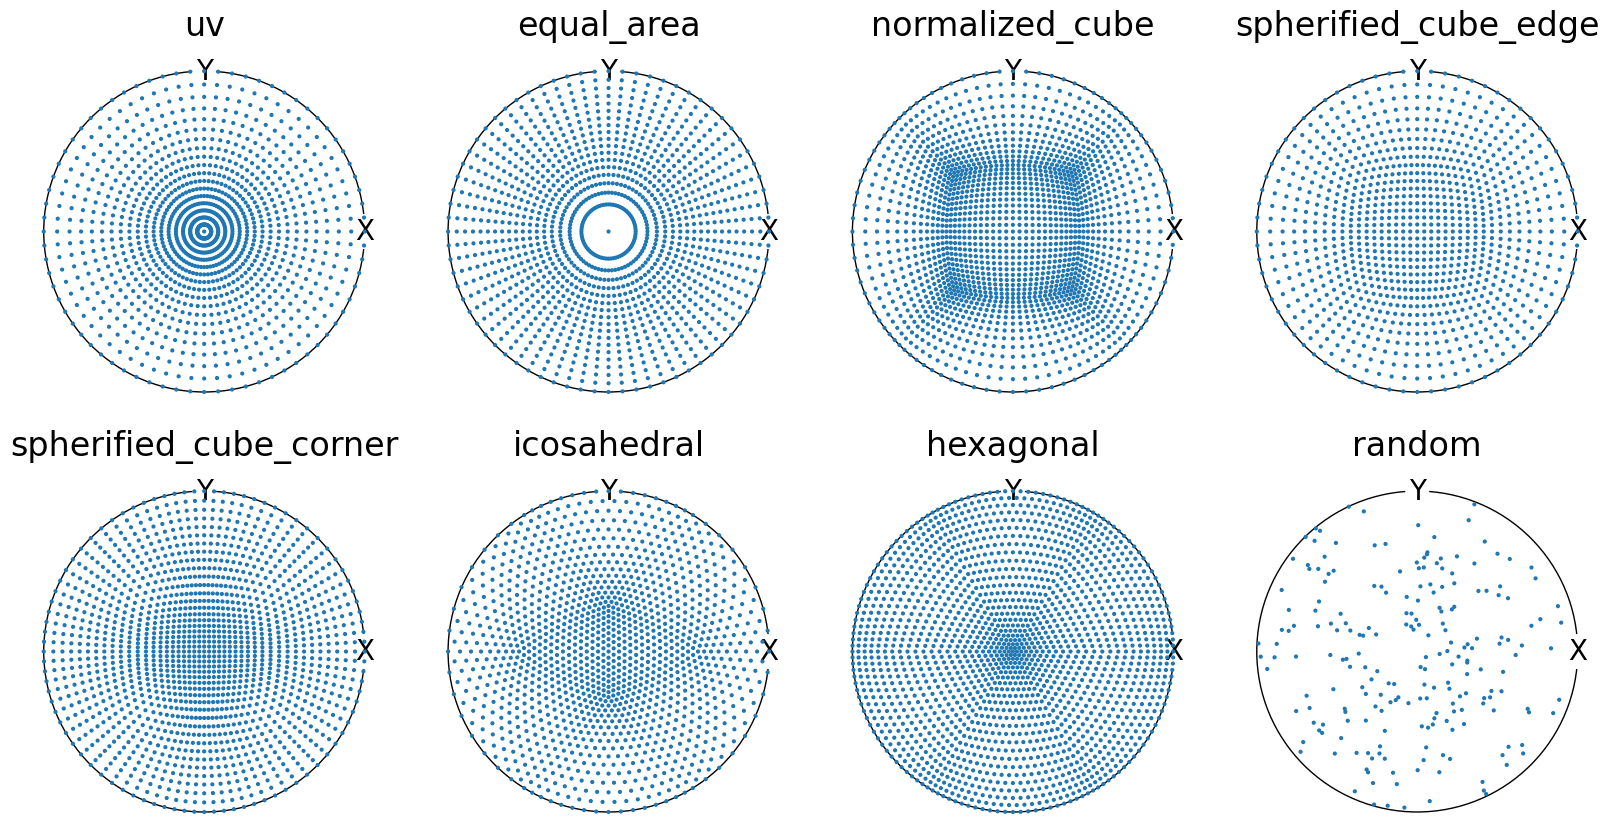
Currently, seven sampling methods are supported, demonstrated below by plotting in stereographic projection, each with different regions of higher and lower sampling density. We should mainly decide on the resolution parameter, which determines the maximum angle (in degrees) between nearest neighbors except in the random sample where it determines the average angle between nearest neighbors.
[2]:
fig, axes = plt.subplots(
    2,
    4,
    subplot_kw=dict(projection="stereographic"),
    figsize=(20, 10),
    facecolor="w",
)
axes = axes.ravel()

for i, sampling_method in enumerate(sample_S2_methods):
    vectors = sample_S2(resolution=5, method=sampling_method)
    axes[i].set_title(sampling_method, pad=20)
    axes[i].set_labels("X", "Y", None)
    axes[i].scatter(vectors);
Sampling the fundamental sector#
Sampling of directions is most relevant when combined with crystal symmetry functionality. In this case, we would want to sample directions in the real crystallographic basis. Usually one only wants to sample the fundamental sector, not the entire sphere, as in the context of a crystal, many directions are symmetrically equivalent. The fundamental sector of a point group represents the smallest region of symmetrically unique directions. The higher the symmetry of the point group, the smaller the fundamental sector.
The symmetry operations are independent of the \(S_2\) sampling methods, so any set of vectors can be limited to the fundamental sector. However, different meshes may be more appropriate for different point groups, as we illustrate below. In general, to sample vectors for crystals with \(\alpha=\beta=\gamma=90^\circ\), one of the cube meshes is recommended. For trigonal or hexagonal crystals that have a 3 or 6-fold axis along [001], a hexagonal mesh is recommended. This ensures that
the boundary of the fundamental sector is also sampled at regular intervals, otherwise some of these edges may appear “ragged”. For lower symmetry crystals, most samplings methods are suitable, and icosahedral sampling is recommended as the points are most evenly spaced.
Below we demonstrate sampling of the fundamental sector for all 32 crystallographic point groups.
[3]:
point_groups = symmetry._groups

color_map = {
    "triclinic": "red",
    "monoclinic": "orange",
    "orthorhombic": "green",
    "tetragonal": "blue",
    "cubic": "brown",
    "trigonal": "magenta",
    "hexagonal": "purple",
}

s2_sampling_map = {
    "triclinic": "icosahedral",
    "monoclinic": "icosahedral",
    "orthorhombic": "spherified_cube_edge",
    "tetragonal": "spherified_cube_edge",
    "cubic": "spherified_cube_edge",
    "trigonal": "hexagonal",
    "hexagonal": "hexagonal",
}

fig, axes = plt.subplots(
    len(point_groups),
    2,
    subplot_kw=dict(projection="stereographic"),
    figsize=(10, 5 * len(point_groups)),
    facecolor="white",
)

for i, point_group in enumerate(point_groups):
    system = point_group.system
    color = color_map[system]
    sampling_method = s2_sampling_map[system]
    mesh = sample_S2(resolution=3, method=sampling_method)
    in_sector = mesh[mesh <= point_group.fundamental_sector]
    axes[i][0].set_title(
        f"{point_group.name} ({system}) (upper)", fontsize=17
    )
    axes[i][0].scatter(in_sector, c=color)
    axes[i][1].set_title(
        f"{point_group.name} ({system}) (lower)", fontsize=17
    )
    axes[i][1].hemisphere = "lower"
    axes[i][1].scatter(in_sector, c=color);
