Clustering across fundamental region boundaries#
In this tutorial we will perform density based clustering of crystal orientations with and without the application of crystal symmetry symmetry using simulated data, as presented in [Johnstone et al., 2020].
Import orix classes and various dependencies
[1]:
# Exchange inline for notebook (or qt5 from pyqt) for interactive plotting
%matplotlib inline

# Import core external
import numpy as np
import matplotlib.pyplot as plt
from sklearn.cluster import DBSCAN

# Colorisation & Animation
from skimage.color import label2rgb
from matplotlib.colors import to_rgb
import matplotlib.animation as animation

# Import orix classes
from orix.quaternion import Orientation, Rotation
from orix.quaternion.symmetry import C1, Oh
Generate artificial data#
Generate three random von Mises distributions of orientations as model clusters and set the Oh (\(m\bar{3}m\)) point group symmetry
[2]:
n_orientations = 50
alpha = 65  # Lower value gives "looser" distribution

# Cluster 1
cluster1 = Rotation.random_vonmises(n_orientations, alpha=alpha)

# Cluster 2
centre2 = Rotation.from_axes_angles((1, 0, 0), np.pi / 4)
cluster2 = Rotation.random_vonmises(
    n_orientations, alpha=alpha, reference=centre2
)

# Cluster 3
centre3 = Rotation.from_axes_angles((1, 1, 0), np.pi / 3)
cluster3 = Rotation.random_vonmises(
    n_orientations, alpha=alpha, reference=centre3
)

# Stack and map into the Oh fundamental zone
ori = Orientation.stack([cluster1, cluster2, cluster3]).flatten()
ori.symmetry = Oh
ori = ori.reduce()
Orientation clustering#
Perform clustering without application of crystal symmetry#
Compute misorientations, i.e. distance between orientations
[3]:
# Remove symmetry by setting it to point group 1 (identity operation)
ori_without_symmetry = Orientation(ori.data, symmetry=C1)

# Misorientations
mori1 = (~ori_without_symmetry).outer(ori_without_symmetry)

# Misorientation angles
D1 = mori1.angle
Perform clustering
[4]:
Labels: [0 1 2 3 4 5]
Perform clustering with application of crystal symmetry#
Compute misorientations, i.e. distance between orientations, with symmetry
[5]:
mori2 = (~ori).outer(ori)

mori2.symmetry = Oh
mori2 = mori2.reduce()

D2 = mori2.angle
Perform clustering
[6]:
dbscan = DBSCAN(
    eps=np.deg2rad(17), min_samples=20, metric="precomputed"
).fit(D2.astype(np.float32))
print("Labels:", np.unique(dbscan.labels_))
Labels: [0 1 2]
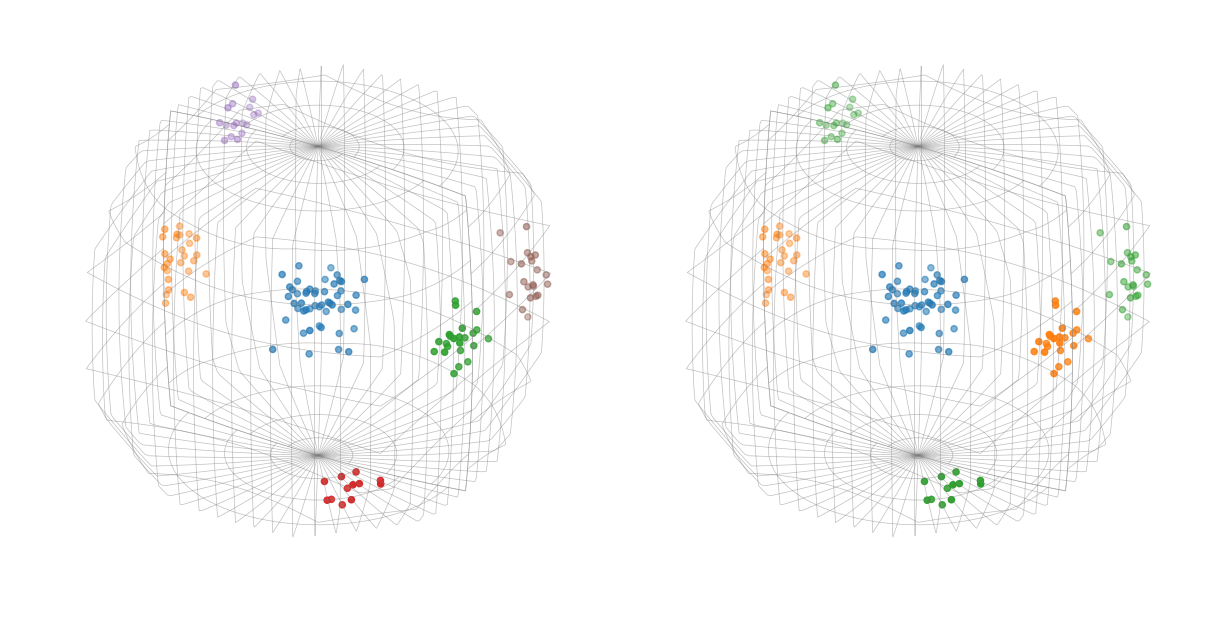
This should have shown that without symmetry there are 6 clusters, whereas with symmetry there are 3.
Visualisation#
Assign colours to each cluster
[7]:
Plot orientation clusters with Matplotlib and (Mis)orientation.scatter()
[8]:
# Set symmetry to "trick" the scatter plot to use the Oh fundamental zone
ori_without_symmetry.symmetry = ori.symmetry

# Create figure with a height/width ratio of 1/2
fig = plt.figure(figsize=(12, 6))

# Add the fundamental zones with clusters to the existing figure
ori_without_symmetry.scatter(figure=fig, position=(1, 2, 1), c=colors_naive)
ori.scatter(figure=fig, position=122, c=colors)
Generate an animation of the plot (assuming an interactive Matplotlib backend is used)
[9]:
def animate(angle):
    fig.axes[0].view_init(15, angle)
    fig.axes[1].view_init(15, angle)
    plt.draw()


ani = animation.FuncAnimation(
    fig, animate, np.linspace(75, 360 + 74, 720), interval=25
)