plot#
- CrystalMap.plot(value: ndarray | str | None = None, overlay: str | ndarray | None = None, scalebar: bool | None = None, scalebar_properties: dict | None = None, legend: bool = True, legend_properties: dict | None = None, colorbar: bool = False, colorbar_label: str | None = None, colorbar_properties: dict | None = None, remove_padding: bool = False, return_figure: bool = False, figure_kwargs: dict | None = None, **kwargs) Figure | None[source]#
Plot a 2D map with any crystallographic map property as map values.
Wraps
matplotlib.axes.Axes.imshow(): see that method for relevant keyword arguments.- Parameters:
- value
An array or an attribute string to plot. If not given, a phase map is plotted.
- overlay
Name of map property or a property array to use in the alpha (RGBA) channel. The property range is adjusted for maximum contrast. Not used if not given.
- scalebar
Whether to add a scalebar along the horizontal map dimension. If not given, a scalebar is added if
matplotlib-scalebaris installed.- scalebar_properties
Keyword arguments passed to
matplotlib_scalebar.scalebar.ScaleBar.- legend
Whether to add a legend to the plot. This is only implemented for a phase plot (in which case default is
True).- legend_properties
Keyword arguments passed to
matplotlib.axes.Axes.legend().- colorbar
Whether to add an opinionated colorbar (default is
False).- colorbar_label
Label of colorbar.
- colorbar_properties
Keyword arguments passed to
orix.plot.CrystalMapPlot.add_colorbar().- remove_padding
Whether to remove white padding around figure (default is
False).- return_figure
Whether to return the figure (default is
False).- figure_kwargs
Keyword arguments passed to
matplotlib.pyplot.subplots().- **kwargs
Keyword arguments passed to
matplotlib.axes.Axes.imshow().
- Returns:
figThe created figure, returned if
return_figure=True.
See also
Examples
>>> from orix import data
>>> xmap = data.sdss_ferrite_austenite(allow_download=True)
>>> xmap
Phase   Orientations       Name  Space group  Point group  Proper point group       Color
    1   5657 (48.4%)  austenite         None          432                 432    tab:blue
    2   6043 (51.6%)    ferrite         None          432                 432  tab:orange
Properties: iq, dp
Scan unit: um
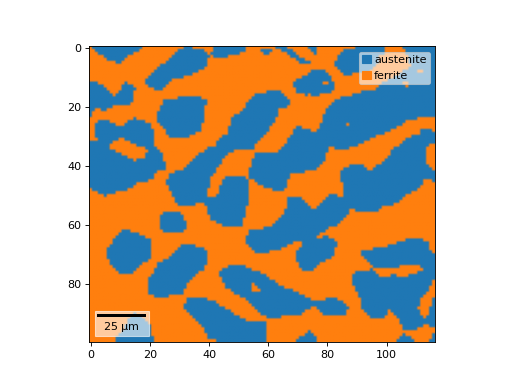
Plot phase map
>>> xmap.plot()
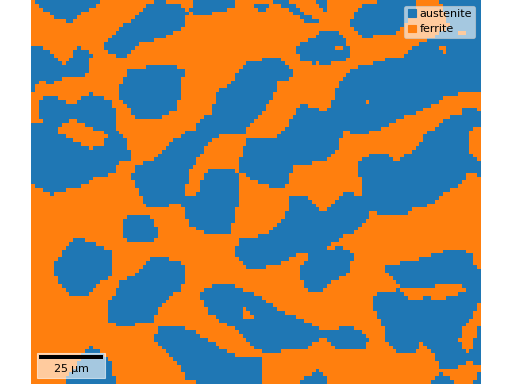
Remove padding and return the figure (e.g. to be saved)
>>> fig = xmap.plot(remove_padding=True, return_figure=True)
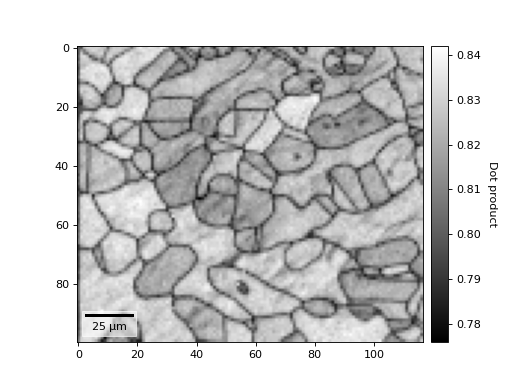
Plot a dot product (similarity score) map
>>> xmap.plot("dp", colorbar=True, colorbar_label="Dot product", cmap="gray")