scatter#
- Vector3d.scatter(projection: str = 'stereographic', figure: Figure | None = None, axes_labels: list[str] | None = None, vector_labels: ndarray | list[str] | None = None, hemisphere: str | None = None, reproject: bool = False, show_hemisphere_label: bool | None = None, grid: bool | None = None, grid_resolution: tuple[float, float] | None = None, figure_kwargs: dict | None = None, reproject_scatter_kwargs: dict | None = None, text_kwargs: dict | None = None, return_figure: bool = False, **kwargs: Any) Figure | None[source]#
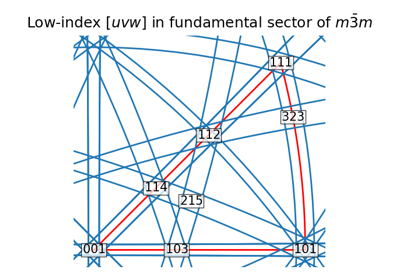
Plot vectors in the stereographic projection.
- Parameters:
- projection
Which projection to use. The default is
"stereographic", the only current option.- figure
Which figure to plot onto. Default is
None, which creates a new figure.- axes_labels
Reference frame axes labels, defaults to
[None, None, None].- vector_labels
Labels for each vector. None are added if not given. Their offsets in stereographic coordinates (X, Y) can be controlled by passing
offsettotext_kwargs.- hemisphere
Which hemisphere(s) to plot the vectors in, defaults to
None, which means"upper"if a new figure is created, otherwise adds to the current figure’s hemispheres. Options are"upper","lower", and"both", which plots two projections side by side.- reproject
Whether to reproject vectors onto the chosen hemisphere. Reprojection is achieved by reflection of the vectors located on the opposite hemisphere in the projection plane. Ignored if
hemisphereis"both". Default isFalse.- show_hemisphere_label
Whether to show hemisphere labels
"upper"or"lower". Default isTrueifhemisphereis"both", otherwiseFalse.- grid
Whether to show the azimuth and polar grid. Default is whatever
axes.gridis set to inmatplotlib.rcParams.- grid_resolution
Azimuth and polar grid resolution in degrees, as a tuple. Default is whatever is default in
stereographic_grid.- figure_kwargs
Dictionary of keyword arguments passed to
matplotlib.pyplot.subplots().- reproject_scatter_kwargs
Dictionary of keyword arguments for the reprojected scatter points which is passed to
scatter(), which passes these on tomatplotlib.axes.Axes.scatter(). The default marker style for reprojected vectors is"+". Values used for vector(s) on the visible hemisphere are used unless another value is passed here.- text_kwargs
Dictionary of keyword arguments passed to
text(), which passes these on tomatplotlib.axes.Axes.text().- return_figure
Whether to return the figure (default is
False).- **kwargs
Keyword arguments passed to
scatter(), which passes these on tomatplotlib.axes.Axes.scatter().
- Returns:
figThe created figure, returned if
return_figure=True.
See also
Notes
This is a somewhat customizable convenience method which creates a figure with axes using
StereographicPlot, however, it is meant for quick plotting and prototyping. This figure and the axes can also be created using Matplotlib directly, which is more customizable.
Examples using Vector3d.scatter#

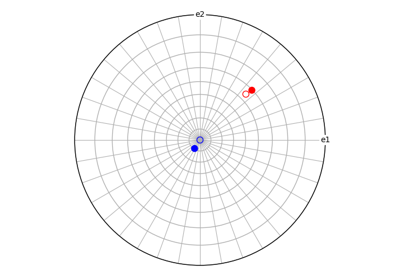
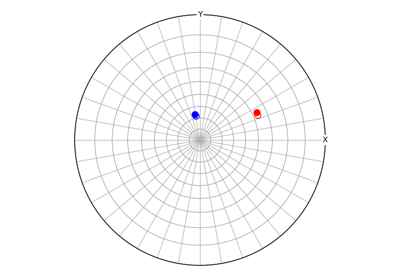

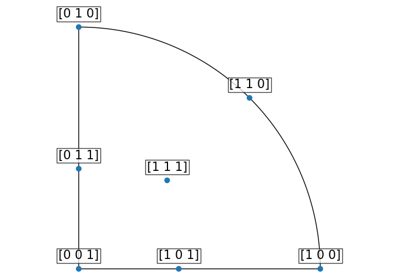
Rotating z-vector to high-symmetry crystal directions