format_labels#
- orix.plot.format_labels(v: ndarray | list | tuple, brackets: tuple[str, str] | None = None, use_latex: bool = True) ndarray[source]#
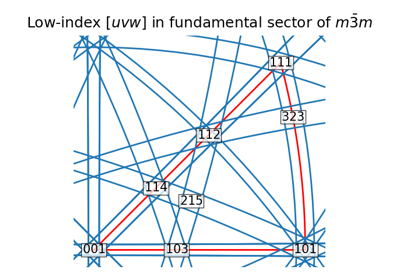
Return formatted vector integer labels.
This function is a convenient way to get nice labels when plotting vectors in the stereographic projection via
scatter()ortext().- Parameters:
- v
Vector labels with the last dimension having a size of 3 or 4. The labels are rounded to the closets integers before being formatted.
- brackets
Left and right parentheses as a tuple of strings. Default is (“(”, “)”). These are typically () or [] when labeling reciprocal (hkl) or direct [uvw] lattice vectors, respectively. If not given, no parentheses are added. If use_latex is True, the brackets {} and <> will be escaped if given.
- use_latex
Whether to use LaTeX when formatting the labels. Default is True.
- Returns:
new_labelsArray of string labels.
Examples
>>> from orix.plot import format_labels
>>> from orix.vector import Vector3d
>>> v = Vector3d([[1, 1, 1], [-2, 0, 1], [4, 0, 0], [-4, 0, 0]])
>>> format_labels(v.reshape(2, 2).data)
array([['$111$', '$\\bar{2}01$'],
       ['$400$', '$\\bar{4}00$']], dtype='<U11')
>>> format_labels(v.data, ("[", "]"), use_latex=False).tolist()
['[111]', '[-201]', '[400]', '[-400]']
>>> format_labels(v.data, ("{", "}")).tolist()
['$\\{111\\}$', '$\\{\\bar{2}01\\}$', '$\\{400\\}$', '$\\{\\bar{4}00\\}$']
>>> format_labels(v.data, ("{", "}"), use_latex=False).tolist()
['{111}', '{-201}', '{400}', '{-400}']
>>> format_labels(v.data, ("<", ">")).tolist()
['$\\left<111\\right>$',
 '$\\left<\\bar{2}01\\right>$',
 '$\\left<400\\right>$',
 '$\\left<\\bar{4}00\\right>$']