pole_density_function#
- StereographicPlot.pole_density_function(*args: ndarray | Vector3d, resolution: float = 1.0, sigma: float = 5.0, log: bool = False, colorbar: bool = True, weights: ndarray | None = None, **kwargs: Any) None[source]#
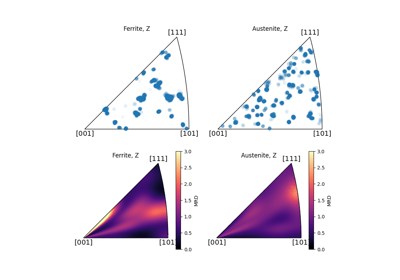
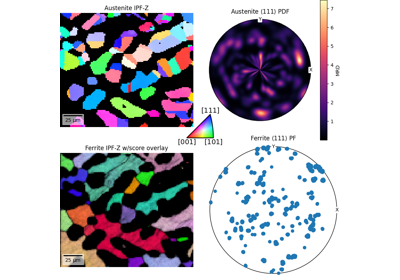
Compute the Pole Density Function (PDF) of vectors in the stereographic projection. See [Rohrer et al., 2004].
- Parameters:
- *args
Vector(s), or azimuth and polar angles of the vectors, the latter passed as two separate arguments.
- resolution
The angular resolution of the sampling grid in degrees. Default value is 1.
- sigma
The angular resolution of the applied broadening in degrees. Default value is 5.
- log
If
Truethe log(PDF) is calculated. Default isTrue.- colorbar
If
Truea colorbar is shown alongside the PDF plot. Default isTrue.- weights
The weights for the individual vectors. If not given, the weight of each vector is 1.
- **kwargs
Keyword arguments passed to
matplotlib.axes.Axes.pcolormesh().