Note
Go to the end to download the full example code.
Color scatter plots#
This example shows different ways to color vectors and (mis)orientations in scatter plots.
import matplotlib as mpl
import matplotlib.pyplot as plt
import numpy as np

from orix.plot import register_projections
from orix.quaternion import Orientation
from orix.quaternion.symmetry import Oh
from orix.vector import Vector3d

register_projections()  # Register our custom Matplotlib projections
np.random.seed(2319)  # Create reproducible random data
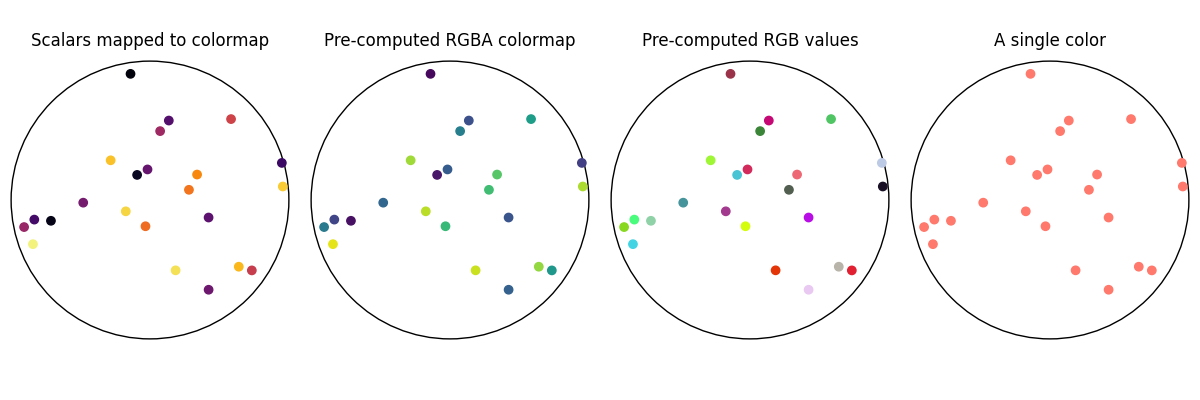
Create some random vectors and plot them in the stereographic projection, coloring by:
Scalar values mapped to a Matplotlib color map
Pre-computed RGBA colormapping from a Matplotlib color map
RGB values
A single color
v = Vector3d.random(50)

c_scalar = np.linspace(0, 1, v.size)
c_rgba = mpl.colormaps["viridis"](c_scalar)
c_rgb = np.random.random(v.size * 3).reshape(v.size, 3)
c_color = "xkcd:salmon"

n = 4
fig = plt.figure(figsize=(n * 3, n), layout="constrained")

ax0 = fig.add_subplot(1, n, 1, projection="stereographic")
ax0.scatter(v, c=c_scalar, cmap="inferno")
ax0.set_title("Scalars mapped to colormap")

ax1 = fig.add_subplot(1, n, 2, projection="stereographic")
ax1.scatter(v, c=c_rgba)
ax1.set_title("Pre-computed RGBA colormap")

ax2 = fig.add_subplot(1, n, 3, projection="stereographic")
ax2.scatter(v, c=c_rgb)
ax2.set_title("Pre-computed RGB values")

ax3 = fig.add_subplot(1, n, 4, projection="stereographic")
ax3.scatter(v, c=c_color)
_ = ax3.set_title("A single color")
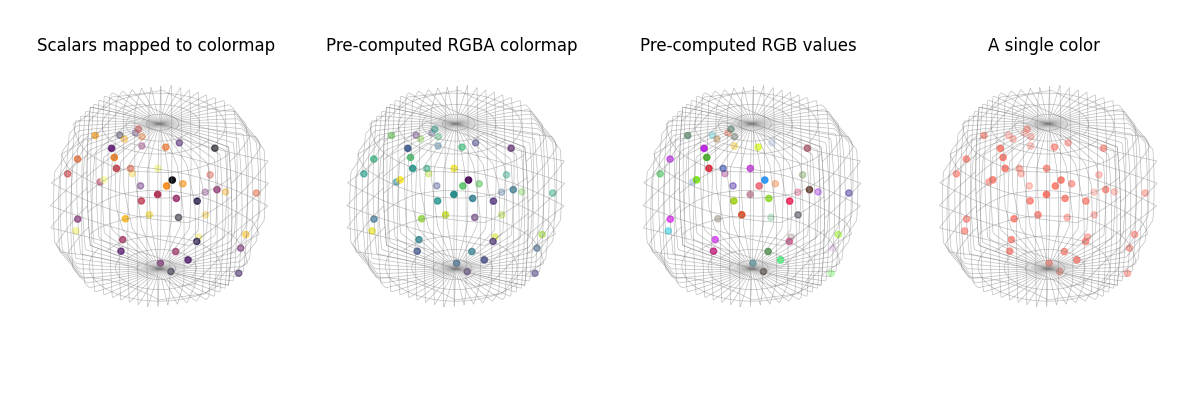
This also works nicely when coloring (mis)orientations
ori = Orientation.random(50)
ori.symmetry = Oh

n = 4
fig = plt.figure(figsize=(n * 3, n), layout="tight")
scatter_kwargs = {"projection": "axangle", "figure": fig}

ori.scatter(c=c_scalar, cmap="inferno", position=(1, n, 1), **scatter_kwargs)
fig.axes[0].set_title("Scalars mapped to colormap")

ori.scatter(c=c_rgba, position=(1, n, 2), **scatter_kwargs)
fig.axes[1].set_title("Pre-computed RGBA colormap")

ori.scatter(c=c_rgb, position=(1, n, 3), **scatter_kwargs)
fig.axes[2].set_title("Pre-computed RGB values")

ori.scatter(c=c_color, position=(1, n, 4), **scatter_kwargs)
_ = fig.axes[3].set_title("A single color")

plt.show()
Total running time of the script: (0 minutes 1.552 seconds)