plot_map#
- CrystalMapPlot.plot_map(crystal_map: CrystalMap, value: ndarray | None = None, scalebar: bool | None = None, scalebar_properties: dict | None = None, legend: bool = True, legend_properties: dict | None = None, override_status_bar: bool = False, **kwargs) AxesImage[source]#
Plot a 2D map with any CrystalMap attribute as map values.
Wraps
matplotlib.axes.Axes.imshow(), see that method for relevant keyword arguments.- Parameters:
- crystal_map
Crystal map object to obtain data to plot from.
- value
Attribute array to plot. If value is
None(default), a phase map is plotted.- scalebar
Whether to add a scalebar along the horizontal map dimension. If not given, a scalebar is added if
matplotlib-scalebaris installed.- scalebar_properties
Dictionary of keyword arguments passed to
mpl_toolkits.axes_grid1.anchored_artists.AnchoredSizeBar.- legend
Whether to add a legend to the plot. This is only implemented for a phase plot (in which case default is
True).- legend_properties
Dictionary of keyword arguments passed to
matplotlib.axes.Axes.legend().- override_status_bar
Whether to display Euler angles and any overlay values in the status bar when hovering over the map (default is
False).- **kwargs
Keyword arguments passed to
matplotlib.axes.Axes.imshow().
- Returns:
imImage object, to be used further to get data from etc.
Examples
>>> from orix import data, plot
>>> from orix.io import load
Import a crystal map
>>> xmap = data.sdss_ferrite_austenite()
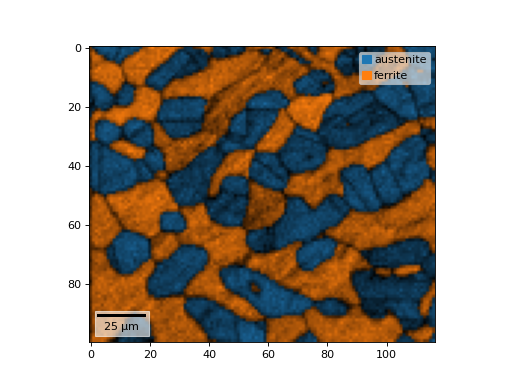
Plot a phase map
>>> fig, ax = plt.subplots(subplot_kw=dict(projection="plot_map"))
>>> _ = ax.plot_map(xmap)
Add an overlay
>>> ax.add_overlay(xmap, xmap.iq)
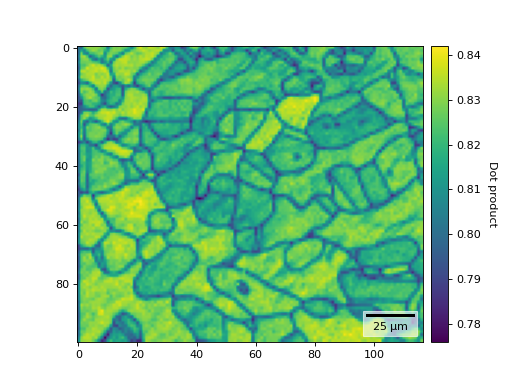
Plot an arbitrary map property, also changing scalebar location
>>> _ = plt.figure()
>>> ax = plt.subplot(projection="plot_map")
>>> _ = ax.plot_map(xmap, xmap.dp, scalebar_properties={"location": 4})
Add a colorbar
>>> cbar = ax.add_colorbar("Dot product") # Get colorbar
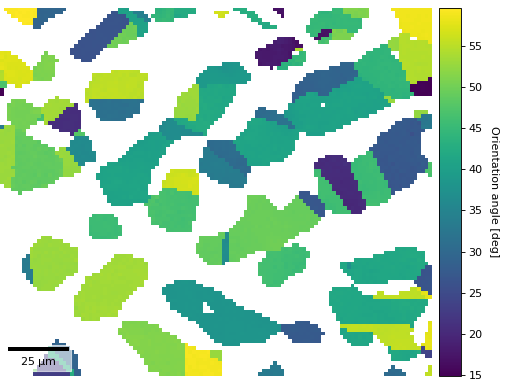
Plot orientation angle in degrees of one phase
>>> xmap2 = xmap["austenite"]
>>> austenite_angles = xmap2.orientations.angle * 180 / np.pi
>>> fig = plt.figure()
>>> ax = fig.add_subplot(projection="plot_map")
>>> im = ax.plot_map(xmap2, austenite_angles)
>>> _ = ax.add_colorbar("Orientation angle [deg]")
Remove all figure and axes padding
>>> _ = ax.remove_padding()
Write annotated figure to file
>>> #fig.savefig("image.png", pad_inches=0, bbox_inches="tight")
Write un-annotated image to file
>>> #plt.imsave("image2.png", im.get_array())